


Overview:
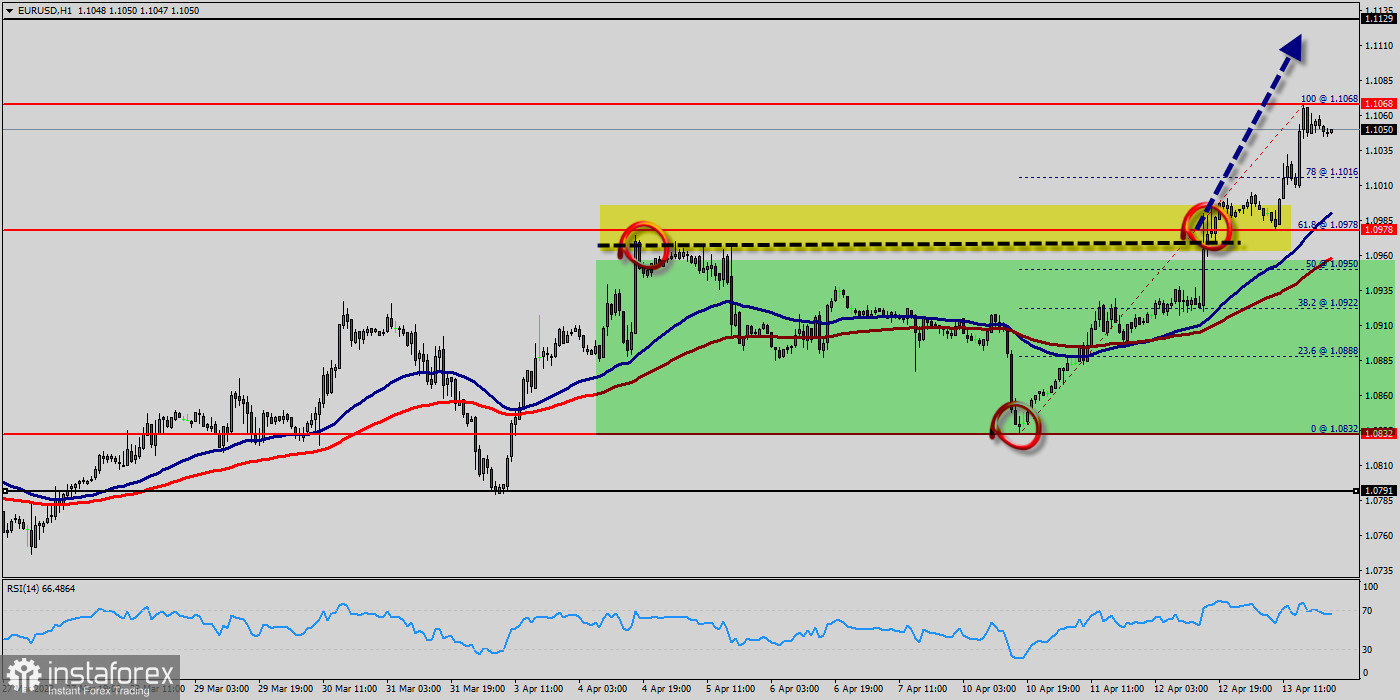
The EUR/USD pair will continue to rise from the level of 1.0978. The support is found at the level of 1.0978, which represents the 61.8% Fibonacci retracement level in the H1 time frame.
The price is likely to form a double bottom. Today, the major support is seen at 1.0832, while immediate resistance is seen at 1.1068. Accordingly, the EUR/USD pair is showing signs of strength following a breakout of a high at 1.1068.
Moreover, the RSI starts signaling an upward trend, and the trend is still showing strength above the moving average (100). Hence, the market is indicating a bullish opportunity above the area of 1.0978. So, the market is likely to show signs of a bullish trend around 1.0978 - 1.1000. In other words, buy orders are recommended above the ratio of 61.8% Fibonacci (1.0978).
So, buy above the level of 1.1068 with the first target at 1.1129 in order to test the daily resistance 1 and move further to 1.1150.
Also, the level of 1.1150 is a good place to take profit because it will form a new double top.
Amid the previous events, the pair is still in an uptrend; for that we expect the EUR/USD pair to climb from 1.0979 to 1.1129 today.
At the same time, in case a reversal takes place and the EUR/USD pair breaks through the support level of 1.0979, a further decline to 1.0832 can occur, which would indicate a bearish market.


