


Overview :
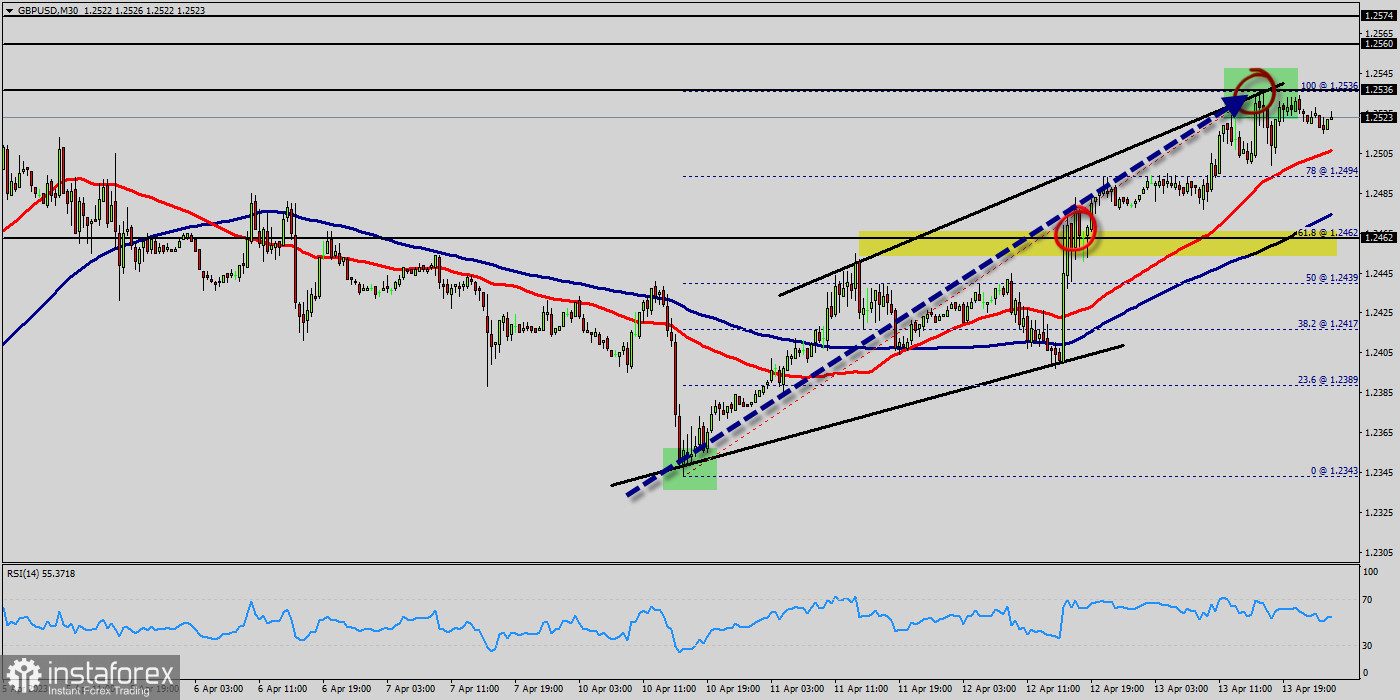
The GBPUSD pair traded with strong positivity yesterday to return to the bullish channel that appears on the chart, to head towards achieving expected additional gains in the upcoming sessions, targeting visiting 1.2522 level mainly. Therefore, we expect to witness more bullish bias in the upcoming sessions, noting that breaking 1.2462 and holding above it will stop the positive scenario and push the price to decline again.
The expected trading range for today is between 1.2462 support and 1.2560 resistance. The GBP/USD pair is going to continue to rise from the level of 1.2462 in the long term.
It should be noted that the support is established at the level of 1.2462 which represents the 61.8% Fibonacci retracement level on the M30 chart. The price is likely to form a double bottom in the same time frame. Accordingly, the GBP/USD pair is showing signs of strength following a breakout of the highest level of 1.2462.
So, buy above the level of 1.2462 with the first target at 1.2536 in order to test the daily resistance 1; and further to 1.2560.
Also, it might be noted that the level of 1.2560 is a good place to take profit because it will form a double top. The price is in a bullish channel now. In the Forex market, liquidity pertains to a currency pair's ability to be bought and sold at the current market price. Additionally, liquidity refers to market volatility and dynamics. Because the Forex market is colossal, it is also extremely liquid. Moreover, if a currency pair has high level of liquidity, it will be easier to trade.
On the other hand, in case a reversal takes place and the GBP/USD pair breaks through the support level of 1.2462, a further decline to 1.2343 can occur which would indicate a bearish market.
Trading recommendations :
The trend is still bullish as long as the price of 1.2463 is not broken. Thereupon, it would be wise to buy above the price of at 1.2463 with the primary target at 1.2536. Then, the GBP/USD pair will continue towards the second target at 1.2560.
In technical analysis: history usually repeats itself at certain level. So it will be of the wisdom to use historic rates to determine future prices. The technical analysis based only on the technical market data (quotes) with the help of various technical indicators. Moreover, in this book we will be touching on a variety of new techniques for applying numerical strategies, equations, formulas and probabilities. Additionally, we will be shared some of classical analysis such as breakout strategy and trend indicators. Alternative scenario : The breakdown of 1.2463 will allow the pair to go further down to the prices of 1.2403 and 1.2343.


