


Trend analysis (Fig. 1)
GBP/USD will continue increasing on Thursday, starting from 1.1792 (closing of yesterday's daily candle) to 1.1894, which is the 23.6% retracement level (red dotted line). Quotes may rise to the historical resistance level of 1.1928 (blue dotted line) when testing this level, but then it will bounce down to lower price levels.
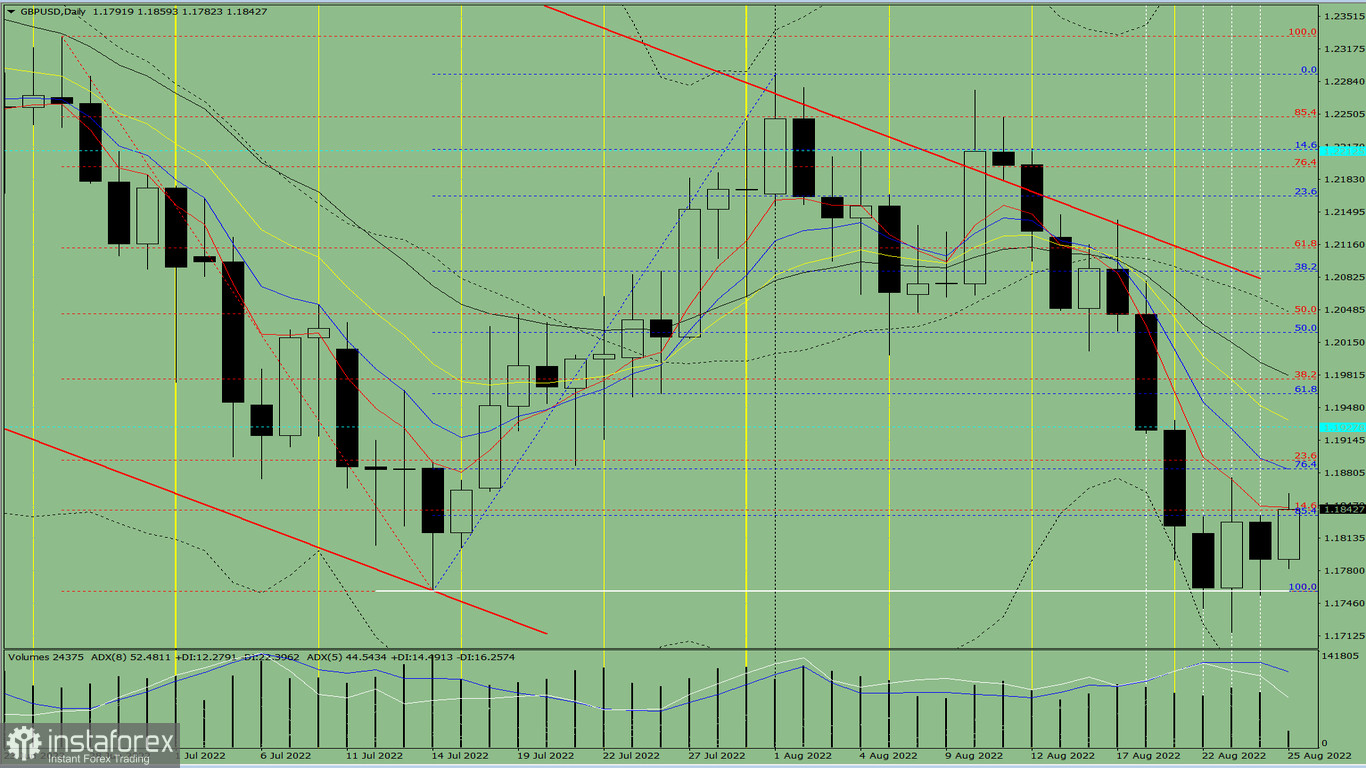
Fig. 1 (daily chart)
Comprehensive analysis:
Indicator analysis -uptrend
Fibonacci levels - uptrend
Volumes - uptrend
Candlestick analysis - uptrend
Trend analysis - uptrend
Bollinger bands - uptrend
Weekly chart - uptrend
Conclusion: GBP/USD will rise from 1.1792 (closing of yesterday's daily candle) to the 23.6% retracement level at 1.1894 (red dotted line), go to the historical resistance level of 1.1928 (blue dotted line), then return to lower price levels.
Alternatively, the pair could move from 1.1792 (closing of yesterday's daily candle) to the 23.6% retracement level at 1.1894 (red dotted line), then fall to the 85.4% retracement level at 1.1837 (dashed blue line). Quotes will resume increasing after these movements.


