


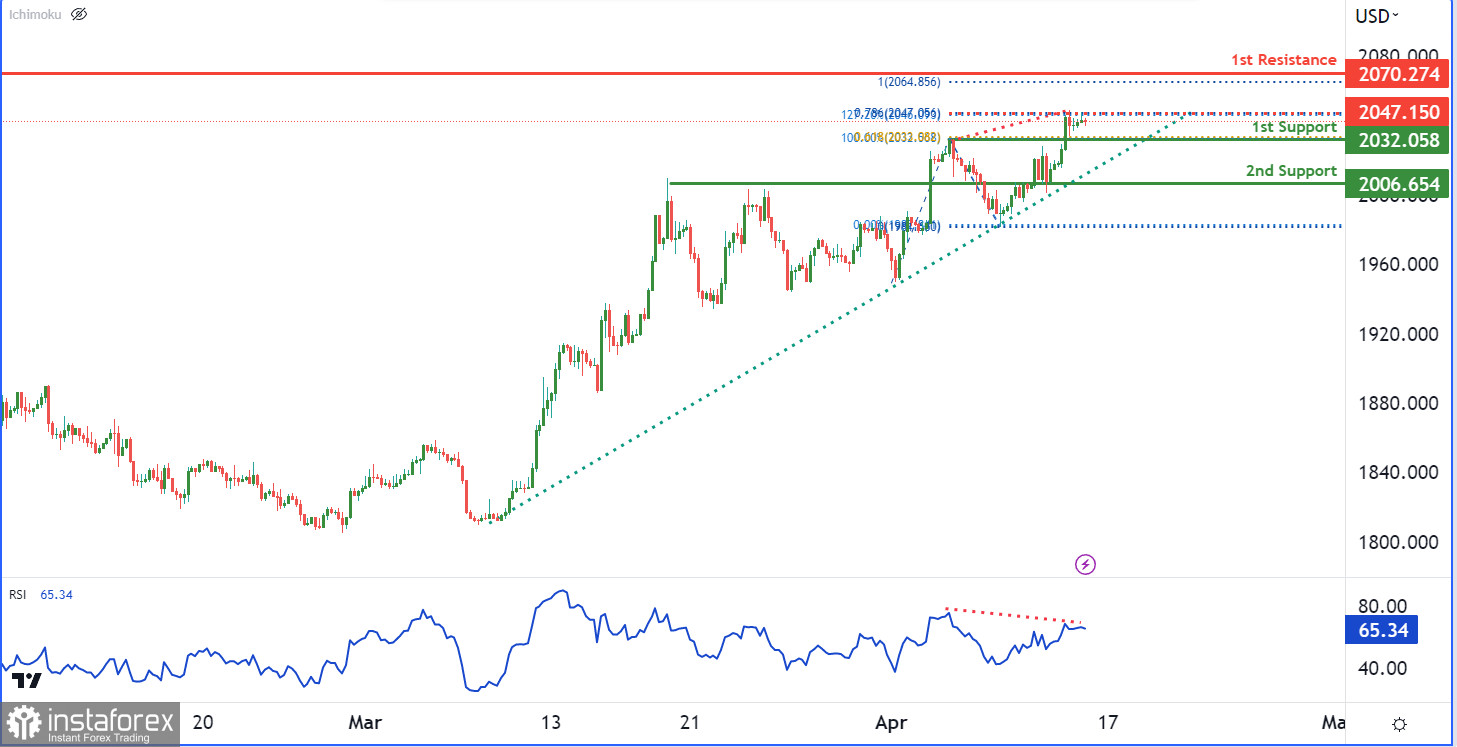
The XAU/USD chart displays a bearish momentum, yet an ascending trend line provides hope for potential bullish movement. A bearish reaction off the first resistance level at 2070.27 may cause prices to drop to the first support level of 2023.03.
The first support level at 2023.03 is a significant level to monitor as it aligns with a 61.80% Fibonacci projection and a pullback support. A break below this level could lead to a further drop in prices towards the next support level of 2006.65, which is an overlap support.
Conversely, if prices break above the first resistance level of 2070.27, it could signify further bullish momentum towards the intermediate resistance level of 2047.15. This level is a multi-swing high resistance and coincides with a 78.60% Fibonacci projection.
Additionally, the RSI shows bearish divergence versus price, indicating a potential reversal soon, further supporting the possibility of prices dropping to the first support level.


