


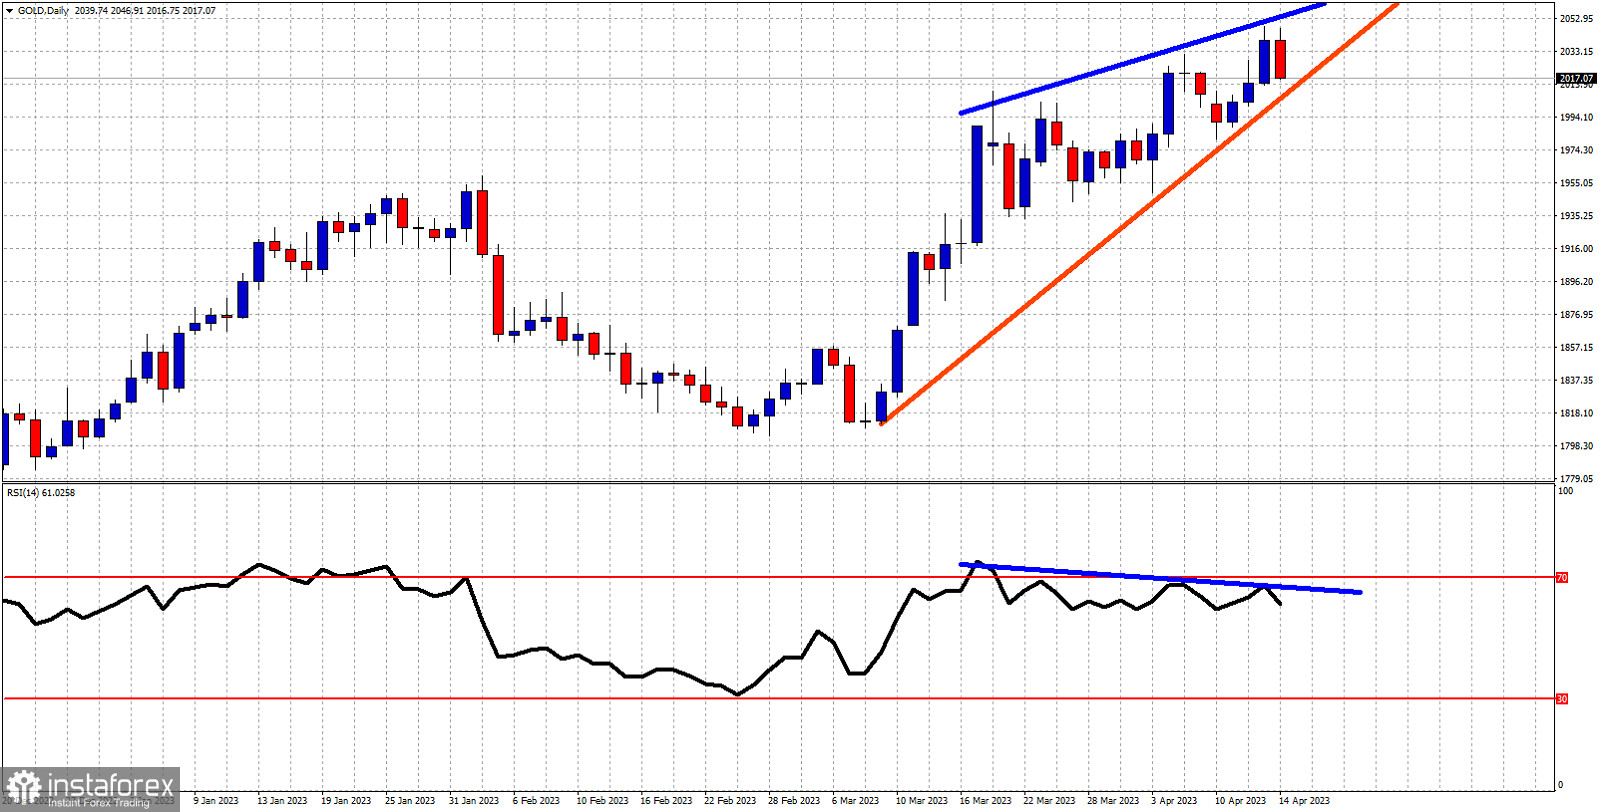
Blue lines- bearish RSI divergence
Red line -support trend line
Gold price is trading around $2,020. Price remains in a bullish trend as price continues making higher highs and higher lows. As we mentioned in previous posts, above $2,030 we have the previous major tops at $2,060-70 area and a rejection here could suggest a bigger pull back. The RSI has provided important warning signs. The bearish RSI divergence is valid. It provides an important warning. Price made a new higher high yesterday at $2,048 and is now under pressure. If the bearish RSI divergence is combined with a break below the red upward sloping support trend line, then we will have a reversal signal. Support at the red trend line is at $2,000. The RSI touched the blue downward sloping line once again forming a new lower high and got rejected. Bulls need to be cautious and protect their gains.


