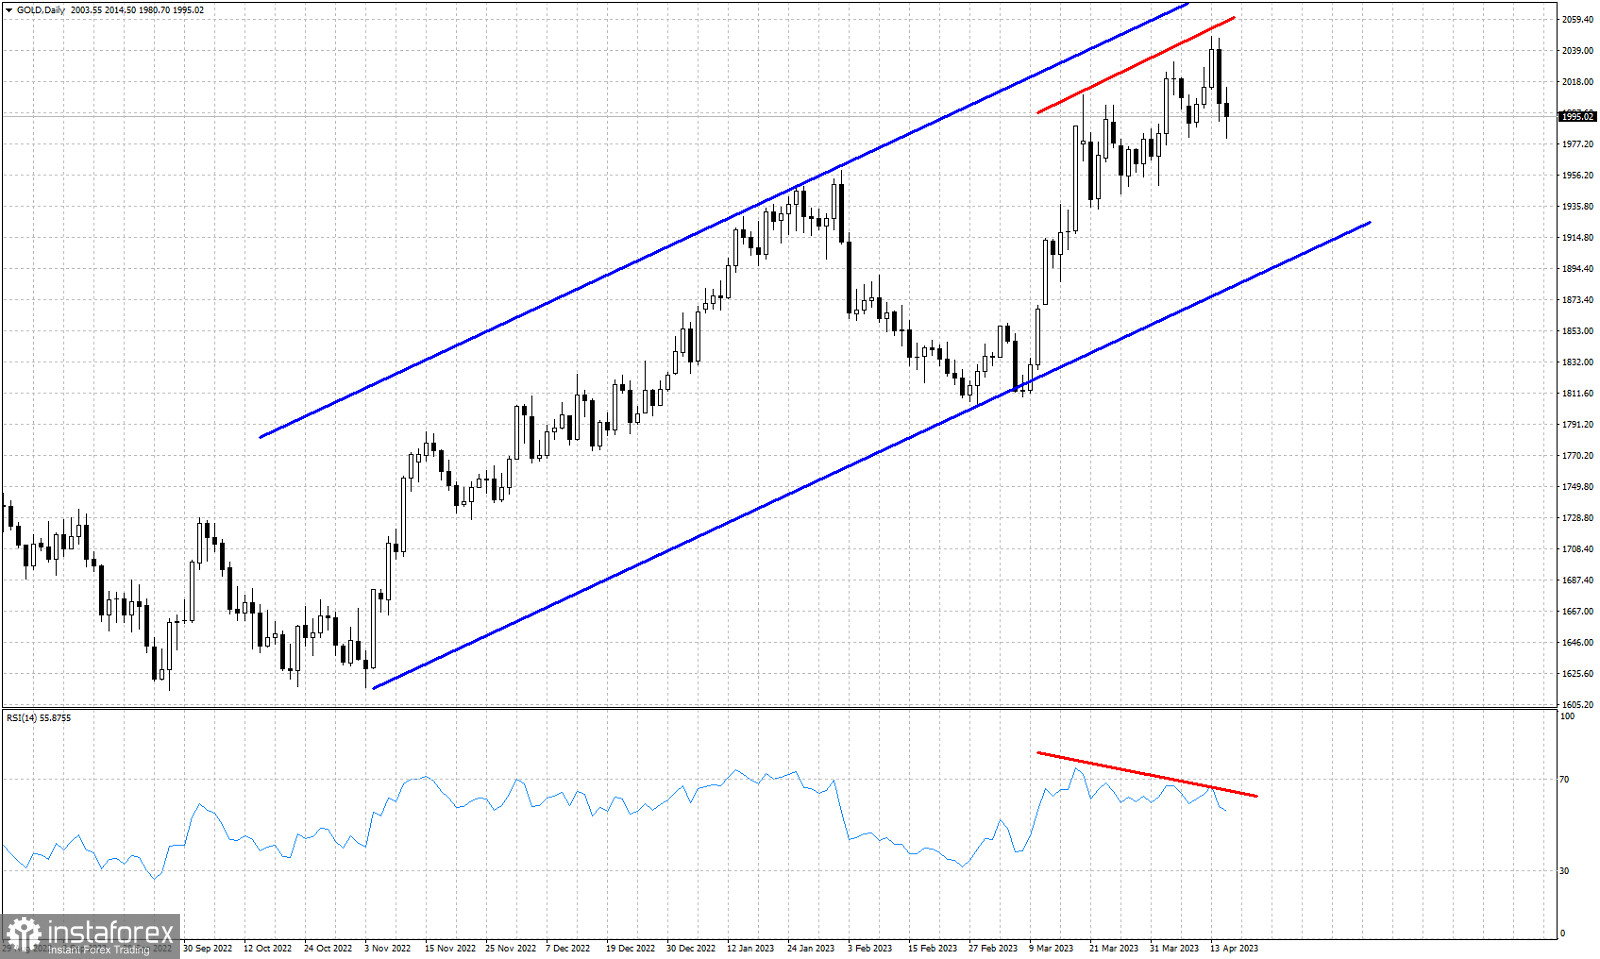
Blue lines- bullish channel
Red lines- bearish RSI divergence
Gold price is trading around $2,000. Price starts the week under pressure. So far there is major worrying sign for bulls. Price looks vulnerable to a pull back. Technically trend remains bullish as price remains inside the blue upward sloping channel. Price is vulnerable to a move towards the lower channel boundary. The RSI provides bearish divergence warnings, but not a reversal signal yet. A move towards $1.900-$1,920 is very probable. We usually see deep pull backs after such bearish divergence signals. The RSI divergence is a warning of a weakening up trend. It is not a reversal signal.


