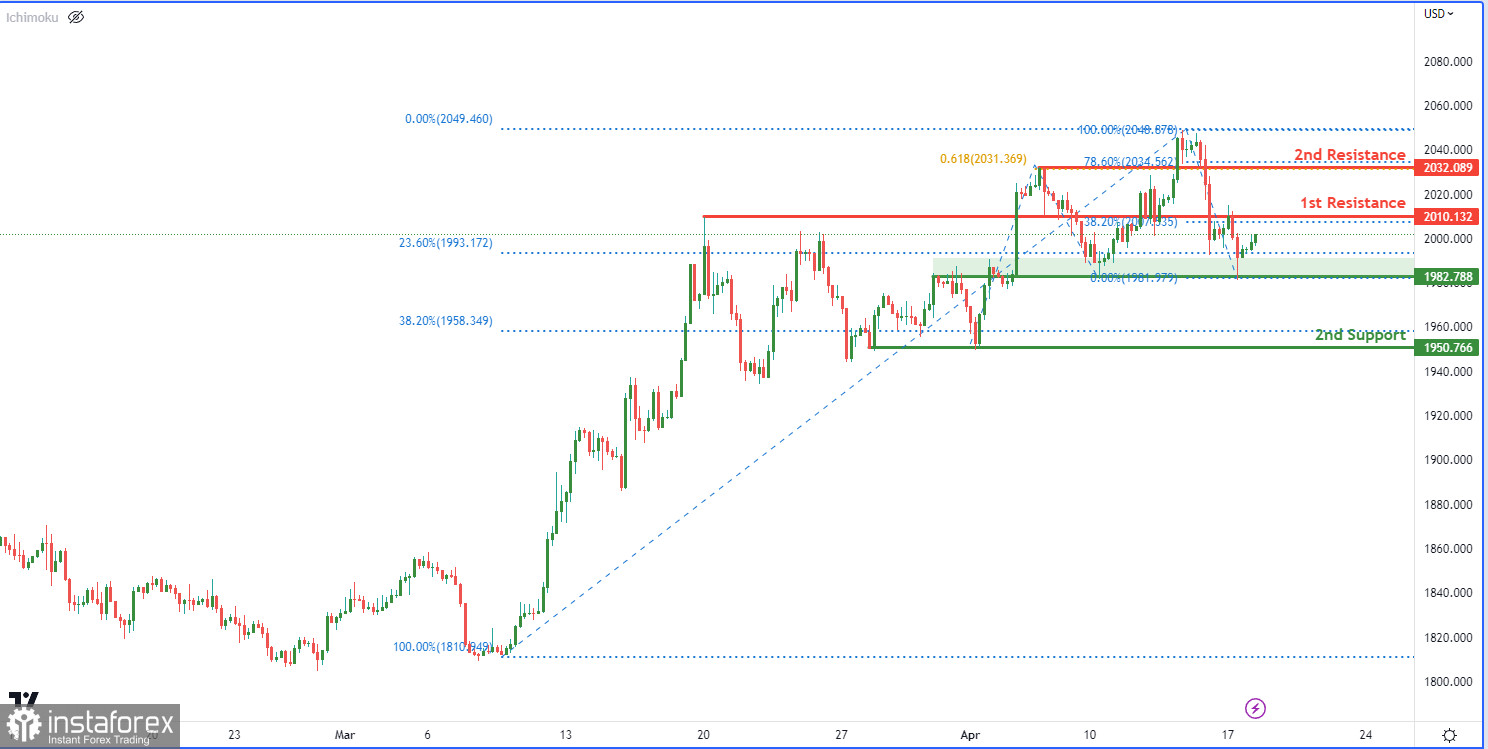
The XAU/USD chart is exhibiting a bullish trend, with potential for continued upward movement towards the 1st resistance at 2010.13. This level is significant due to its role as both an overlap resistance and a 38.20% Fibonacci retracement level. If the price successfully breaks above this resistance, traders may find another buying opportunity at the 2nd resistance level of 2032.08, which is a pullback resistance and a 61.80% Fibonacci projection level.
However, if the price declines, traders should keep an eye on the 1st support level at 1982.78, which is an overlap support and a 23.60% Fibonacci retracement level. If the price falls below this support, the 2nd support level at 1950.76 may provide another potential buying opportunity, as it has served as a multi-swing low support and is also a 38.20% Fibonacci retracement level.


