


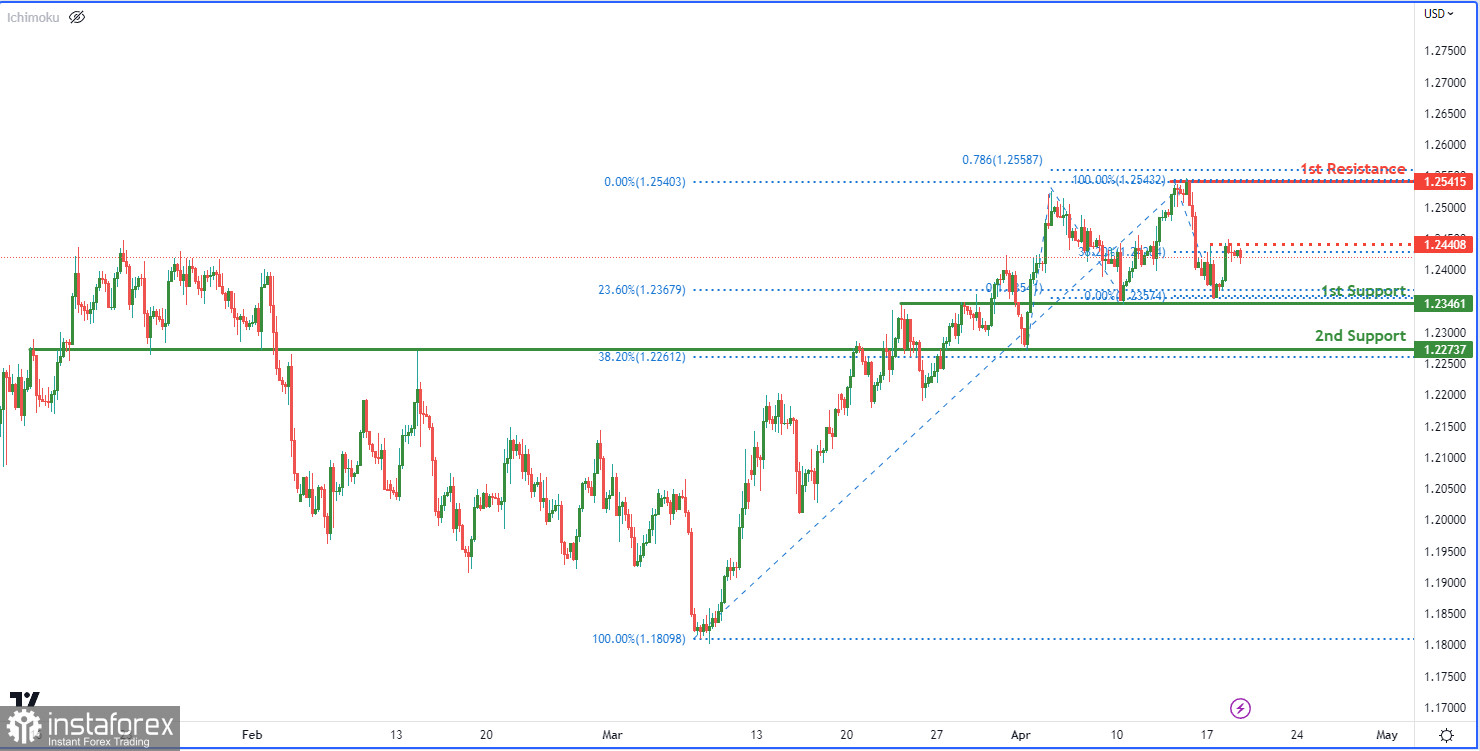
The GBP/USD chart is displaying a bullish bias, suggesting a possible continuation towards the first resistance level. The chart's bullish momentum is supported by price trading above an ascending support line.
The first support level is located at 1.2346, which is a robust overlap support level and is also aligned with the 23.60% Fibonacci retracement level. Additionally, the second support level is at 1.2273, which is another overlap support level, coinciding with the 38.20% Fibonacci retracement level.
The first resistance level is at 1.2541, which is a swing high resistance level and is also aligned with the 78.60% Fibonacci projection level. If price manages to breach this resistance level, it could potentially trigger a strong bullish momentum towards the intermediate resistance level at 1.2440, which is also a swing high resistance level.


