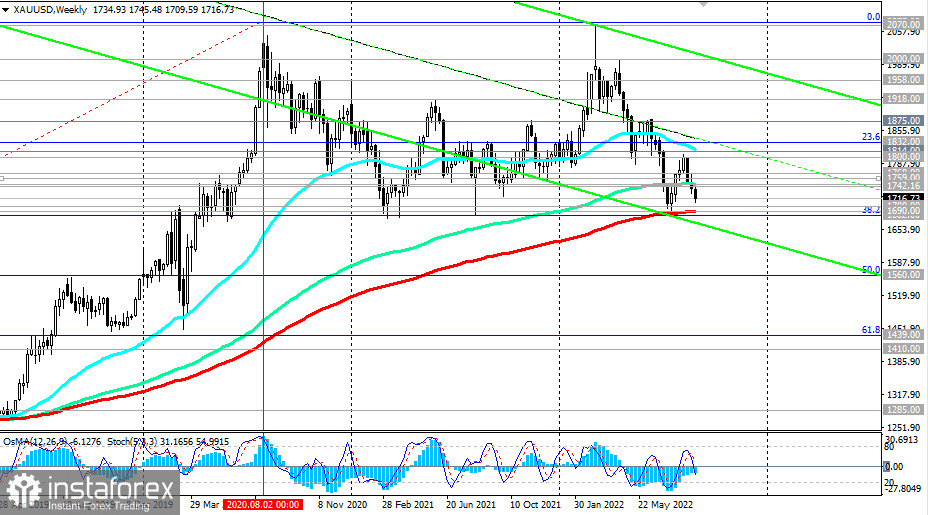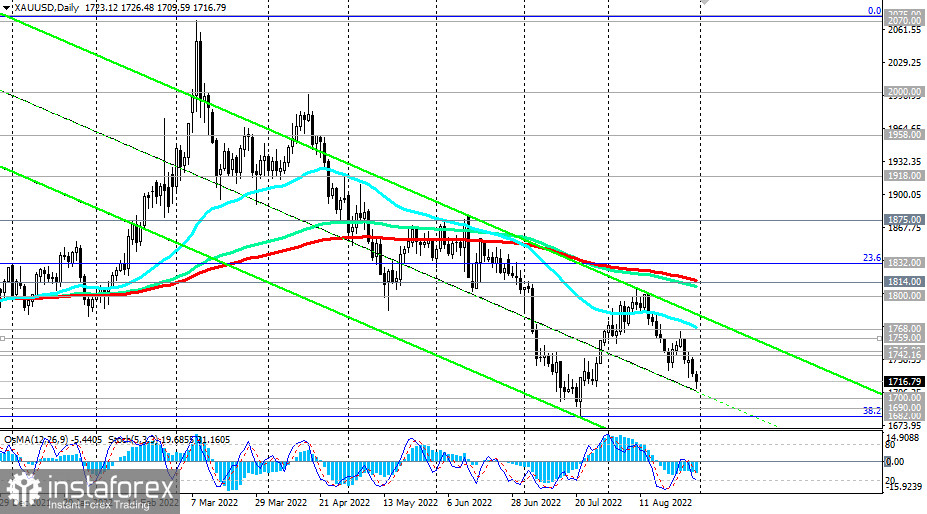
Gold is giving way to its role as a defensive asset to the dollar, and the XAU/USD pair is declining towards the key support levels of 1700.00, 1690.00 (200 EMA on the weekly chart), 1682.00 (38.2% Fibonacci retracement correction to the growth wave since December 2015 and the 1050.00 mark).

In the event of their breakdown, the long-term bullish trend of the XAU/USD pair may be in jeopardy.
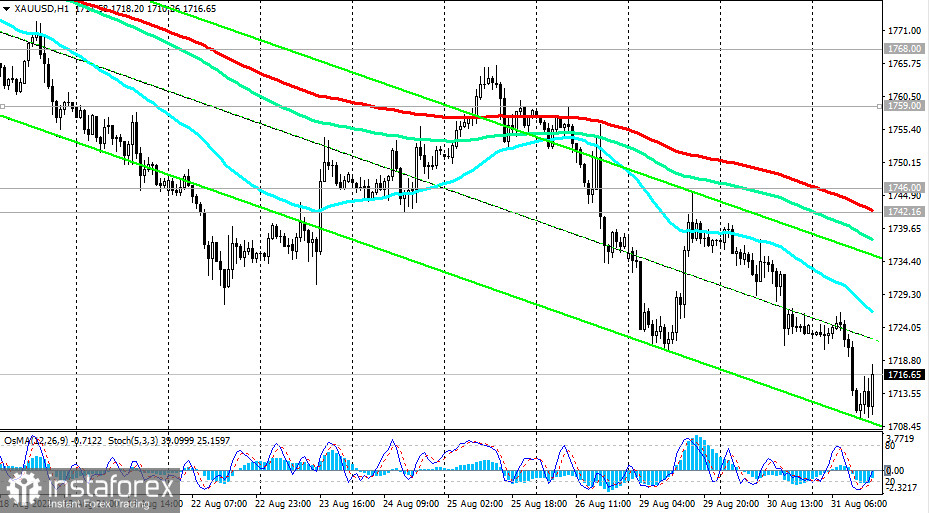
In an alternative scenario, there will be a rebound from these support levels, and a breakdown of the important resistance levels of 1742.00 (200 EMA on the 1-hour chart), 1746.00 (144 EMA on the weekly chart) will become a signal for the resumption of long positions. The breakdown of the key resistance level 1814.00 (200 EMA on the daily chart) will confirm the scenario of the resumption of the long-term bullish trend of XAU/USD.

Support levels: 1700.00, 1690.00, 1682.00
Resistance levels: 1742.00, 1746.00, 1759.00, 1768.00, 1800.00, 1814.00, 1832.00, 1875.00
Trading Tips
Sell Stop 1708.00. Stop-Loss 1727.00. Take-Profit1700.00, 1690.00, 1682.00
Buy Stop 1727.00. Stop-Loss 1708.00. Take-Profit 1742.00, 1746.00, 1759.00, 1768.00, 1800.00, 1814.00, 1832.00, 1875.00


