


Yesterday, traders received several good signals to enter the market. Let us focus on the 5-minute chart to clear up the market situation. Earlier, I asked you to pay attention to the level of 1.0016 to decide when to enter the market. A breakout and an upward test of 1.0016 led to a perfect sell signal. What is more, the eurozone inflation report intensified pressure on the euro, causing a sell-off near 0.9985, which allowed traders to earn about 30 pips. A false breakout of 0.9985 gave a buy signal, but the pair increased by just 10 pips. In the second part of the day, bears protected the resistance level of 1.0011 and formed a perfect sell signal. However, the euro jumped amid weak data on the US labor market, and traders suffered losses.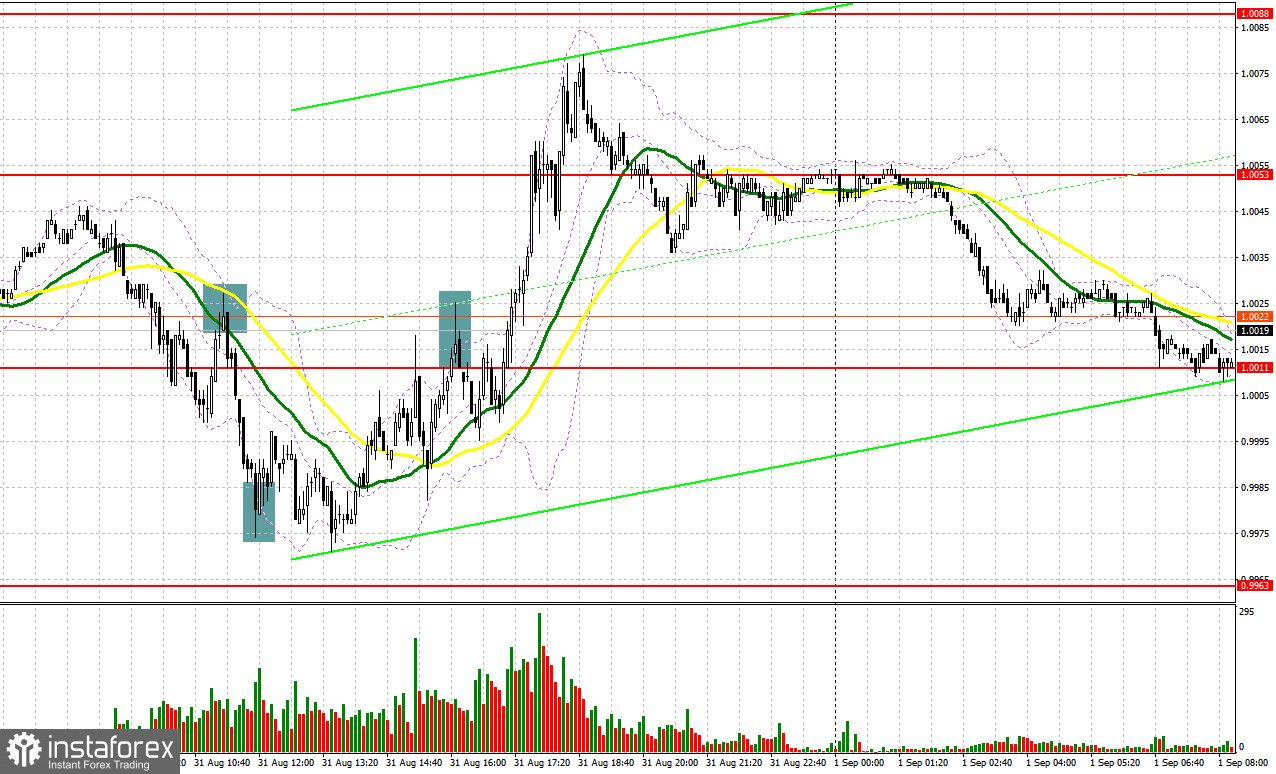
Conditions for opening long positions on EUR/USD:
To maintain the upward correction, bulls should reach new highs. However, it will be quite difficult to do so. Only very good economic reports from the eurozone may boost the euro. Traders should pay attention to Germany's retail sales, Germany's and eurozone manufacturing PMI, and the eurozone unemployment rate in July. If the eurozone business activity recovers, bulls will have a chance to protect the parity level and push the price higher. Otherwise, pressure on the euro/dollar pair will increase again. In this case, it will be better to go long after a false breakout of 0.9973. This will form a perfect entry point with the target at 1.0030. A breakout and a downward test of this level may affect bears', thus encouraging traders to buy above the parity level. In the event of this, the pair may continue its correction towards the level of 1.0076. The next target is located at the resistance level of 1.0127, where it is recommended to lock in profits. If the euro/dollar pair declines and buyers fail to protect 0.9973, pressure on the pair will return as the price will break the lower limit of the upward correctional channel formed on August 23. That is why it will be wise to go long after a false breakout of the low of 0.9923. Traders may also open buy positions just after a bounce off 0.9861 or lower – from 0.9831, expecting a rise of 30-35 pips within the day.
Conditions for opening short positions on EUR/USD:
Today, sellers should primarily protect the resistance level of 1.0030. A false breakout of this level may lead to a drop to 0.9973, a lower limit of the upward correctional channel formed on August 23. A future movement of the pair highly depends on this level. That is why a breakout and settlement below this level as well as an upward test will give an additional sell signal. In this case, the pair may slide to 0.9923 or even to 0.9861, where it is recommended to lock in profits. The next target is located at the low of 0.9831. If the euro/dollar pair increases during the European session amid strong reports and bears fail to protect 1.0030, the pair will have a chance to jump even higher. Against the backdrop, traders should avoid short orders until the price hits 1.0076 and forms a false breakout. It is also possible to go short just after a rebound from the high of 1.0127 or even higher – from 1.0155, expecting a decline of 30-35 pips.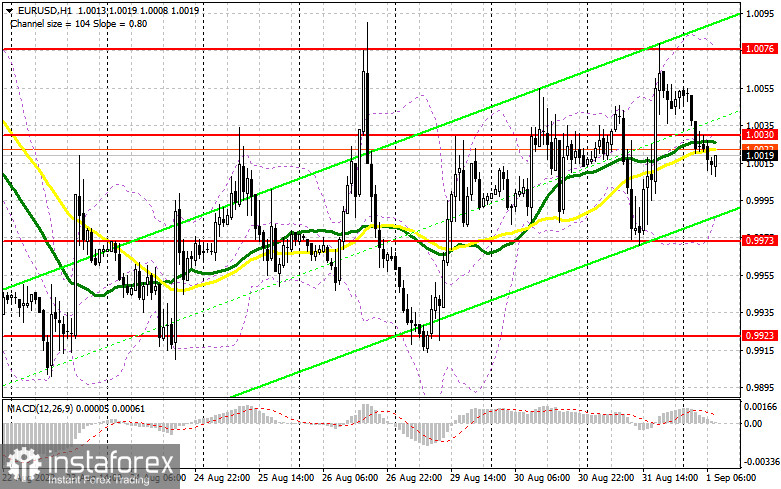
COT report
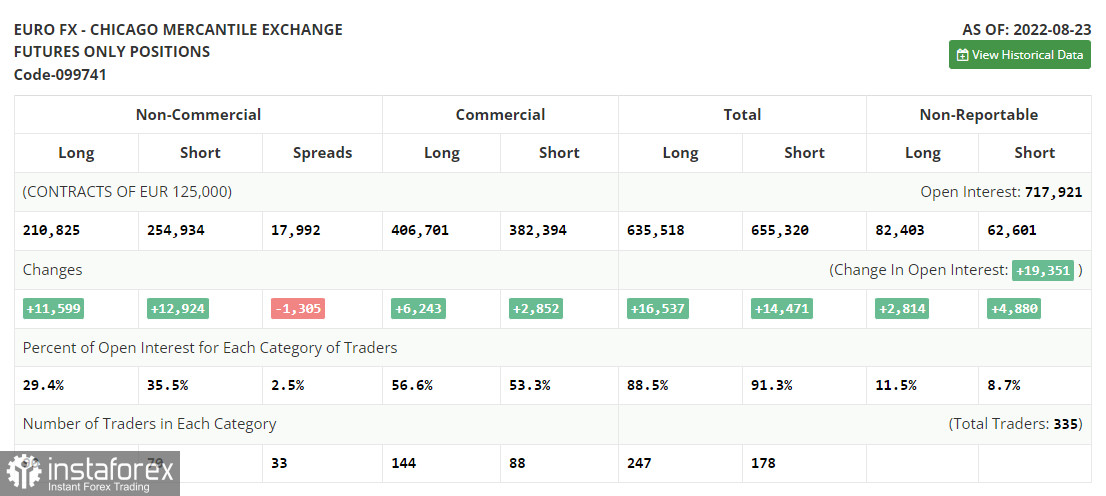
According to the COT report from August 23, the number of both long and short positions soared. This fact points to great interest among traders, especially after the euro dropped below the parity level. Fed Chair Jerome Powell's speech in Jackson Hole led to a surge in volatility and provided short-lived support for the US dollar. However, big traders prevent the pair from falling below the parity level and become more active every time it starts losing value. Jerome Powell said that the Fed would do its best to cap inflation. That is why the regulator is likely to keep the current pace of monetary policy tightening. Since traders priced in such an outcome before the symposium, the euro managed to stay intact. This week, traders should analyze the US labor market data that has a considerable influence on the Fed's plans. Thus, a strong labor market may contribute to high inflation, thus forcing the Fed to raise the benchmark rate even more. The COT report reads that the number of long non-commercial positions increased by 11,599 to 210,825, whereas the number of short non-commercial positions jumped by 12,924 to 254,934. At the end of the week, the total non-commercial net position remained negative and decreased to -44,109 against -42,784, which reflects pressure on the euro and a further fall in the trading instrument. The weekly closing price decreased to 0.9978 from 1.0191.
Signals of indicators:
Moving Averages
Trading is performed below 30- and 50-day moving averages, which points to the end of the upward correction.
Note: The period and prices of moving averages are considered by the author on the one-hour chart, which differs from the general definition of the classic daily moving averages on the daily chart.
Bollinger Bands
If the pair declines, the support level will be located at the lower limit of the indicator near 1.0000. In case of a rise, the upper limit of the indicator located at 1.0076 will act as resistance.
Description of indicators- Moving average (moving average, determines the current trend by smoothing volatility and noise). The period is 50. It is marked in yellow on the chart.
- Moving average (moving average, determines the current trend by smoothing volatility and noise). The period is 30. It is marked in green on the graph.
- MACD indicator (Moving Average Convergence/Divergence - convergence/divergence of moving averages). A fast EMA period is 12. A slow EMA period is 26. The SMA period is 9.
- Bollinger Bands. The period is 20.
- Non-profit speculative traders are individual traders, hedge funds, and large institutions that use the futures market for speculative purposes and meet certain requirements.
- Long non-commercial positions are the total number of long positions opened by non-commercial traders.
- Short non-commercial positions are the total number of short positions opened by non-commercial traders.
- The total non-commercial net position is a difference in the number of short and long positions opened by non-commercial traders.


