


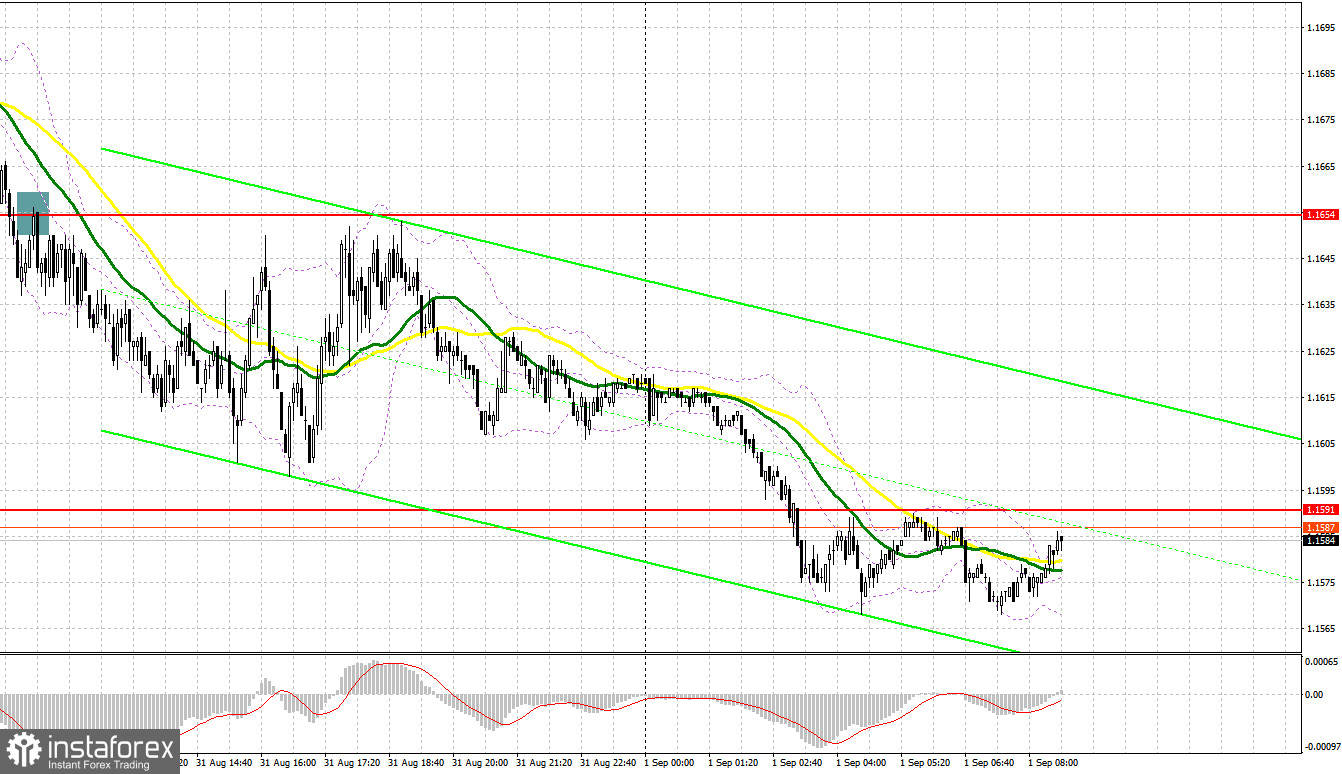
Only one signal to sell the pound was formed yesterday. Let's take a look at the 5-minute chart and see what happened. I paid attention to the 1.1654 level in my morning forecast and advised making decisions on entering the market from it. A breakthrough and reverse test from the bottom up of this range gave a sell signal, which eventually resulted in a move down by more than 50 points. Before the test and false breakout of the level of 1.1654 in the afternoon, I lacked literally one point, so I couldn't get a point from there to open new short positions.
When to go long on GBP/USD:
Obviously, the pressure on the pound continues to increase, including due to the large spread in the interest rates of central banks. The cost of living crisis, high inflation and the British economy rapidly sliding into recession leave no chance for bulls on the pound. Against this background, it is time to talk about updating the low that was reached for the pair during the beginning of the coronavirus pandemic in 2020 - this is, for a minute, 1.1409. Today we expect the release of the index of business activity in the manufacturing sector in the UK for August this year. It is unlikely that it will be revised for the better, so there is no need to have much hope for the restoration of the pair. In case GBP/USD falls further, forming a false breakout in the area of the nearest support at 1.1540 will lead to the first signal to open long positions in anticipation of a correction to the area of 1.1595. A lot also depends on this level, since its breakthrough can pull stop orders from speculative bears. A test of 1.1595 from top to bottom will testify to a return of demand for the pound and creates a buy signal with growth to a more distant level of 1.1650, where moving averages are passing, playing on the bears' side. The farthest target will be the area of 1.1714, where I recommend taking profits.
If the GBP/USD falls further, which is more likely, and there are no bulls at 1.1540, the pressure on the pair will increase. A breakthrough of this range will lead to the renewal of the next annual low. In this case, I advise you to postpone long positions until the next support at 1.1479, but you can act there only on a false breakout. I recommend opening long positions on GBP/USD immediately for a rebound from 1.1409, or even lower - around 1.1360, counting on correcting 30-35 points within the day.
When to go short on GBP/USD:
Bears continue to push the pound downward. The only problem for them now is the beginning of a new month, which may lead to a small upward correction in the pound, which many have been expecting for a long time. Therefore, selling on the breakdown of annual lows is a rather risky strategy. It is much better to act on the basis of an upward correction and weak fundamental statistics, which is expected today in the UK. In this case, you can put a short stop with a fairly extensive potential for the pound's decline. The optimal scenario for selling GBP/USD would be forming a false breakout at the level of 1.1595, which was formed at the end of yesterday. This will make it possible to achieve a new fall and renewal of annual lows around 1.1540. A breakdown and reverse test of this range will give a new entry point for selling with a fall to 1.1479, and the area of 1.1409 will be a further target, where I recommend taking profits.
In case GBP/USD grows and there are no bears at 1.1595, there will be ghostly chances for an upward correction, and bulls will get an excellent opportunity to return to 1.1650, where the moving averages play on the bears' side. Only a false breakout there will provide an entry point into short positions based on the pair moving downward. If there is no activity there, I advise you to sell GBP/USD immediately for a rebound from 1.1714, counting on the pair's rebound down by 30-35 points within the day.
COT report:
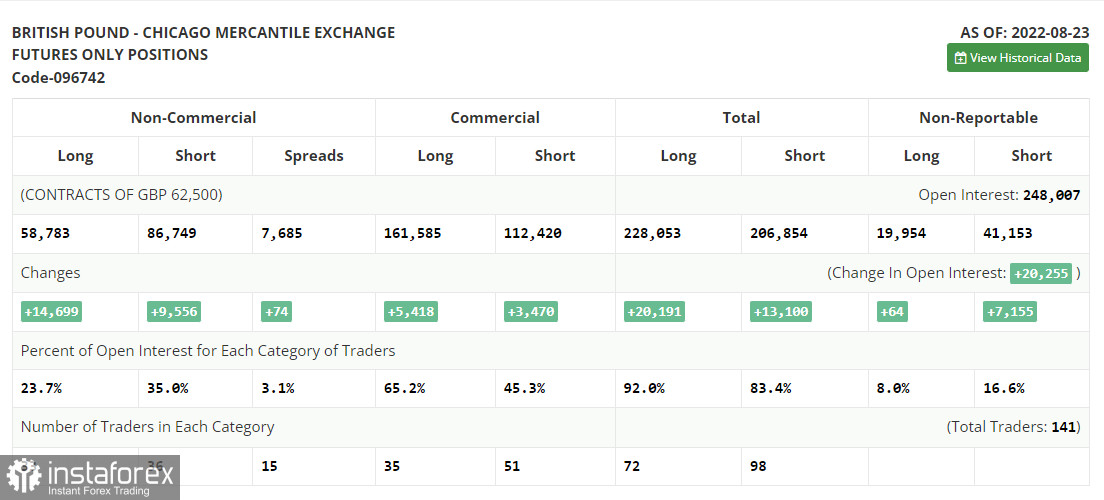
The Commitment of Traders (COT) report for August 23 logged an increase in both short positions and long positions. And although the latter turned out to be a bit more, these changes did not affect the real current picture. Serious pressure on the pair remains, and recent statements by Federal Reserve Chairman Jerome Powell that the committee will continue to aggressively raise interest rates further have only increased pressure on the British pound, which has been experiencing quite a lot of problems lately. Expected high inflation and a looming cost-of-living crisis in the UK does not give traders room to take long positions, as a fairly large range of weak fundamentals is expected ahead, likely to push the pound even further below the levels at which it is currently trading. This week, it is important to pay attention to data on the US labor market, which, among other things, determine the Fed's decision on monetary policy. Continued resilience with low unemployment will lead to higher inflationary pressures going forward, forcing the Fed to further raise interest rates, putting pressure on risky assets, including the British pound. The latest COT report indicated that long non-commercial positions rose 14,699 to 58,783, while short non-commercial positions rose 9,556 to 86,749, leading to a slight rise in the negative non-commercial net position to -27,966 against - 33,109. The weekly closing price fell off from 1.1822 against 1.2096.
Indicator signals:
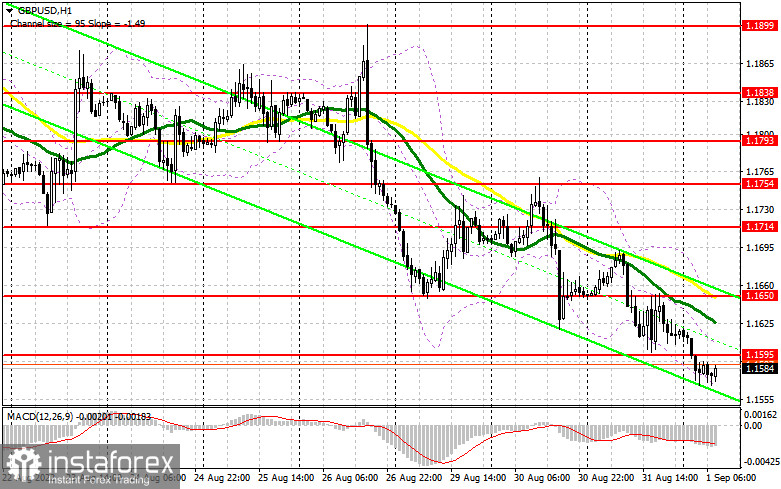
Trading is below the 30 and 50-day moving averages, which indicates further decline in the pair.
Moving averages
Note: The period and prices of moving averages are considered by the author on the H1 hourly chart and differs from the general definition of the classic daily moving averages on the daily D1 chart.
Bollinger Bands
In case the pair goes down, the lower border of the indicator around 1.1570 will act as support. In case of growth, the upper border of the indicator around 1.1650 will act as resistance.
Description of indicators
- Moving average (moving average, determines the current trend by smoothing out volatility and noise). Period 50. It is marked in yellow on the chart.
- Moving average (moving average, determines the current trend by smoothing out volatility and noise). Period 30. It is marked in green on the chart.
- MACD indicator (Moving Average Convergence/Divergence — convergence/divergence of moving averages) Quick EMA period 12. Slow EMA period to 26. SMA period 9
- Bollinger Bands (Bollinger Bands). Period 20
- Non-commercial speculative traders, such as individual traders, hedge funds, and large institutions that use the futures market for speculative purposes and meet certain requirements.
- Long non-commercial positions represent the total long open position of non-commercial traders.
- Short non-commercial positions represent the total short open position of non-commercial traders.
- Total non-commercial net position is the difference between short and long positions of non-commercial traders.


