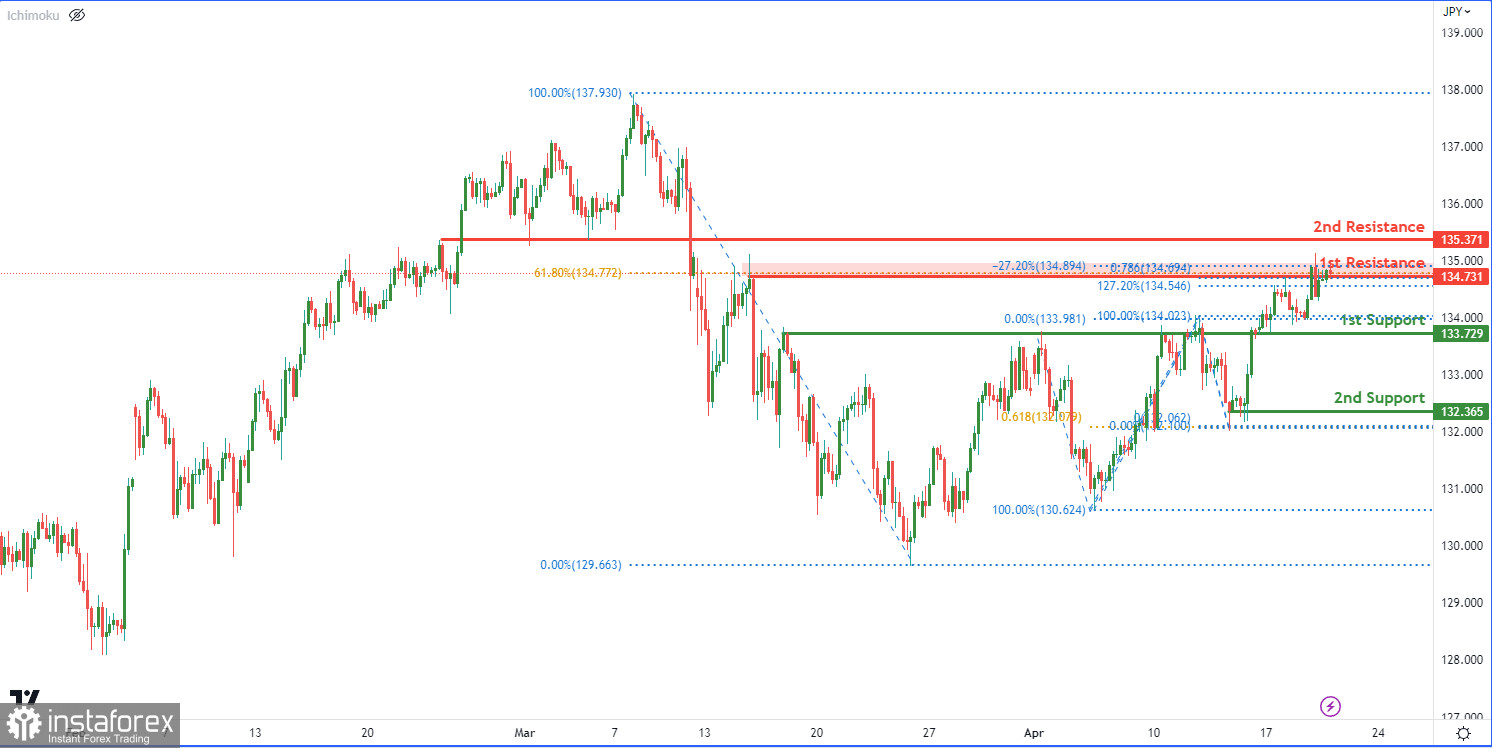
The USD/JPY chart shows an overall bearish momentum, which can be seen in the current downtrend. The first support level is at 133.72, which is an overlap support level. Another support level is at 132.36, which is also an overlap support level and coincides with the 61.80% Fibonacci projection.
On the other hand, the first resistance level is at 134.73, which is a multi-swing high resistance level and coincides with the 61.80% Fibonacci retracement level. The second resistance level is at 135.37, which is a pullback resistance level.
If the price fails to break the first resistance level, it could potentially continue the bearish momentum towards the first support level. In the event that the first support level is breached, the next support level it could drop to is the second support level at 132.36.


