


Analysis of Thursday's deals:
30M chart of the GBP/USD pair
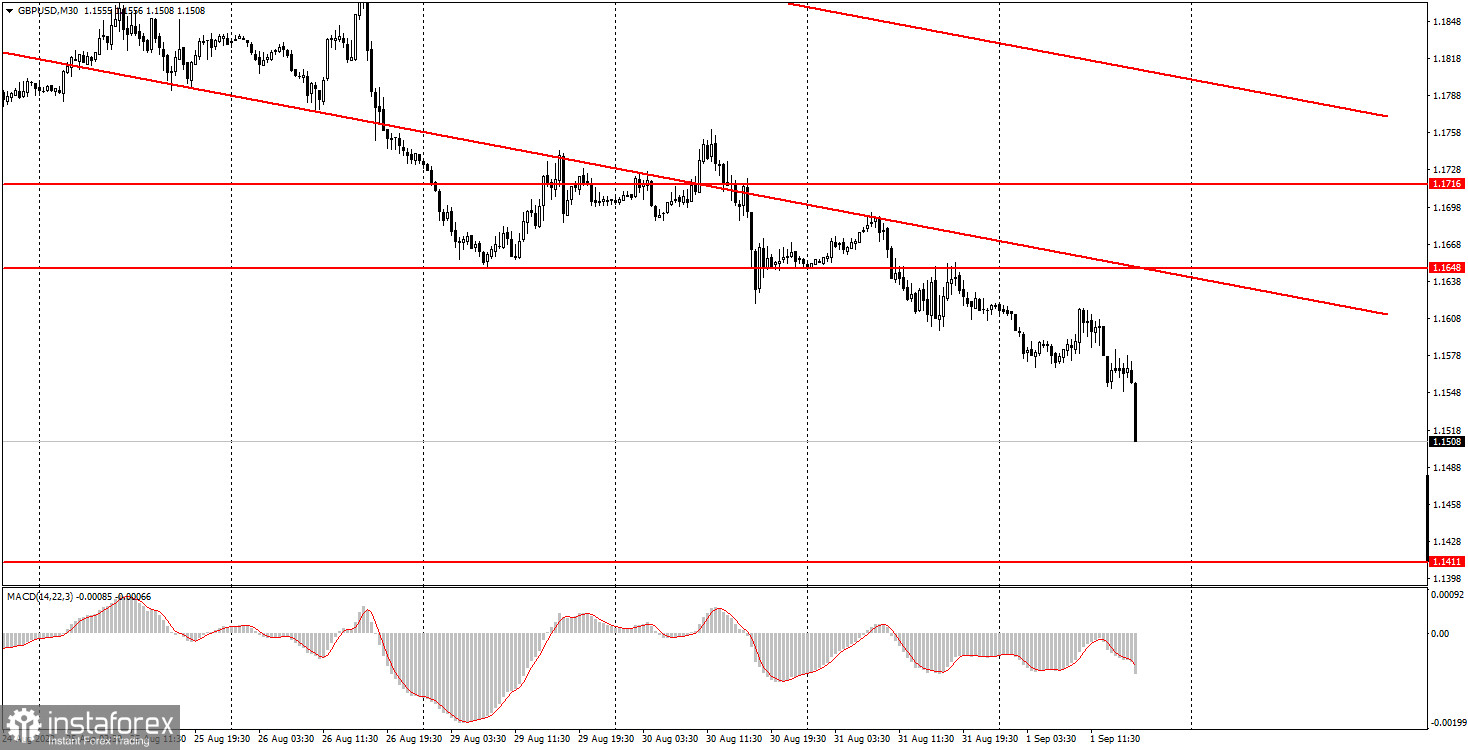
The GBP/USD pair continued its downward movement on Thursday after a slight rollback to the upside. Approximately the same picture we observed in the previous days of the current week. Thus, nothing new. The pound is still depreciating and is already only 120 points from its 37-year lows. The market had no grounds for new short positions on the British currency today. In the UK, only the index of business activity in the services sector came out in the second assessment for August, and the ISM index in the US, which is important, but its value did not differ from the previous month's value. Thus, the market had nothing to react to. However, the pound continued to fall and renewed its 2-year lows, which are somehow irrelevant to talk about, as the pair may soon update its 37-year lows. The price is still below the descending channel, which indicates only one thing: the downward movement is not only maintained, but also intensified. Thus, buying the pair right now does not make sense.
5M chart of the GBP/USD pair
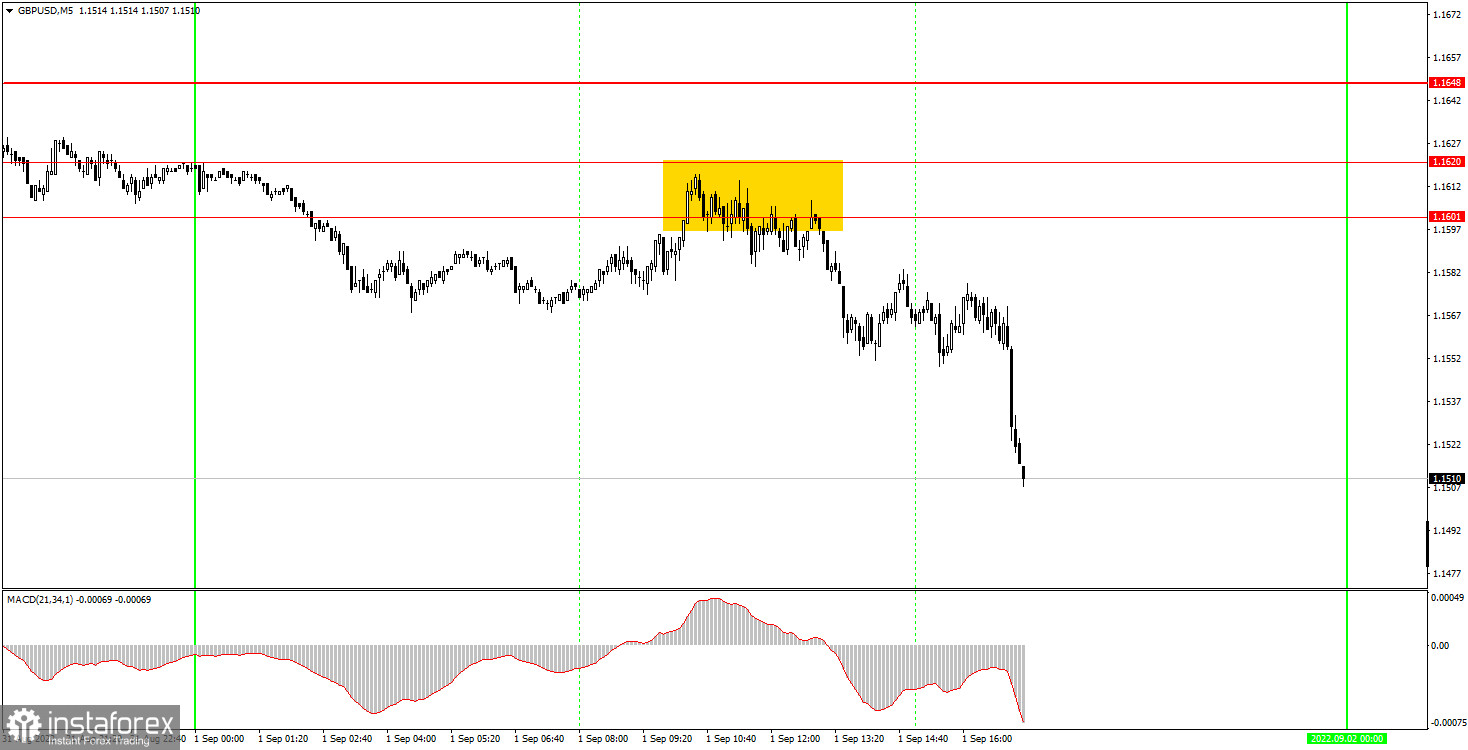
The pound/dollar pair did not show good movements on the 5-minute timeframe. However, if false signals were constantly formed in the first days of the week and did not allow novice traders to earn, then only one signal was formed on Thursday. But what! Before starting a new round of decline, the pound corrected to the 1.1601-1.1620 area and rebounded from it. There was no duality in this signal, and traders had to open short positions. At the moment, short positions should be in profit of about 70-80 points, and since there are simply no other levels below the level of 1.1601, the deal will definitely have to be closed manually. Therefore, newcomers managed to make very good money according to our recommendations, and we congratulate them.
How to trade on Friday:
The pound/dollar pair continues to follow a downward trend on the 30-minute TF. The level of 1.1648 was easily overcome and now there is only one level down - 1.1411 - a low for the last 37 years. We have little doubt that the price will reach it, as well as update it. However, Friday will be the most important day of the week in terms of macroeconomics, so anything is possible. On the 5-minute time frame on Friday it is recommended to trade at 1.1411, (today's low), 1.1601, 1.1620, 1.1648, 1.1716. When the price passes after opening a deal in the right direction for 20 points, Stop Loss should be set to breakeven. Nothing interesting is planned for Friday in the UK either. We recommend paying attention to the NonFarm Payrolls report in America, on which a lot will depend. Reports on unemployment and wages are also important, but the reaction to them can hardly be recognized under the veil of the reaction to Nonfarm.
Basic rules of the trading system:
1) The signal strength is calculated by the time it took to form the signal (bounce or overcome the level). The less time it took, the stronger the signal.
2) If two or more deals were opened near a certain level based on false signals (which did not trigger Take Profit or the nearest target level), then all subsequent signals from this level should be ignored.
3) In a flat, any pair can form a lot of false signals or not form them at all. But in any case, at the first signs of a flat, it is better to stop trading.
4) Trade deals are opened in the time period between the beginning of the European session and until the middle of the US one, when all deals must be closed manually.
5) On the 30-minute TF, using signals from the MACD indicator, you can trade only if there is good volatility and a trend, which is confirmed by a trend line or a trend channel.
6) If two levels are located too close to each other (from 5 to 15 points), then they should be considered as an area of support or resistance.
On the chart:
Support and Resistance Levels are the Levels that serve as targets when buying or selling the pair. You can place Take Profit near these levels.
Red lines are the channels or trend lines that display the current trend and show in which direction it is better to trade now.
The MACD indicator (14,22,3) consists of a histogram and a signal line. When they cross, this is a signal to enter the market. It is recommended to use this indicator in combination with trend lines (channels and trend lines).
Important speeches and reports (always contained in the news calendar) can greatly influence the movement of a currency pair. Therefore, during their exit, it is recommended to trade as carefully as possible or exit the market in order to avoid a sharp price reversal against the previous movement.
Beginners on Forex should remember that not every single trade has to be profitable. The development of a clear strategy and money management are the key to success in trading over a long period of time.


