The GBP/USD currency pair calmly continued its decline against the US dollar on Thursday. What can we say about a currency that updates its 2-year lows every day, when even the European currency does without falling? Which continues to fall for no reason (local and current) against the background of a missing fundamental and macroeconomic background? Of course, we can say that geopolitics on the European continent remains difficult, the UK may lose Scotland, the "Northern Ireland Protocol" may lead to a trade war with the EU, and the British economy is already guaranteed to survive a long and painful recession. All this would be true if it weren't for a few "buts." If the UK loses Scotland, which aspires to return to the EU, it will not happen soon. The British economy is going through hard times, but the American economy is also stalling. If geopolitics remains difficult for another five years, will the pound sterling fall all this time? If that's the case, we have bad news for the pound sterling.
So far, we believe the market continues to eliminate the British currency by inertia. On the one hand, it's a sin to complain. Traders have an excellent downward trend with virtually no corrections and rollbacks. It remains only to have the time to sell the pair and calculate the profit. However, in this part of the article, we are thinking about the prospects of the pound/dollar pair, and so far, they remain such that only technical analysis can help to sort them out. First, since we are dealing with a long-term downward trend, we must pay attention to the 24-hour TF. There, the pair is located far below the Ichimoku cloud, the critical line, and for any trading system, all indicators now indicate a downward movement. It means it will be possible to count on the pound's growth only when technical indicators begin to at least turn up. Moreover, reversals on the 4-hour TF and below will mean local corrections. We need a powerful and sharp upward movement to complete the downward trend.
The Nonfarm Payrolls report is unlikely to help the British currency.
Meanwhile, the pound has slipped even more, and now it has to go a little more than 100 points to reach 37-year lows. This is to the question of how long it will take the pair to overcome 400 points down. We asked ourselves a similar question last week and suggested that such a distance could be overcome in a week or two. So far, this is what is going on. The UK news calendar is empty this week. Yesterday's report on business activity in the services sector, which turned out to be even slightly higher than the previous estimate and forecasts, looked like a mockery of the pound sterling, which did not pay any attention to it. Thus, the pound can only count on the Nonfarm Payrolls report, which will become available today.
We do not believe nonfarm will drop sharply and drag the US dollar with them. Even if monetary policy is tightened, which implies a deterioration in the labor market, it is unlikely that a key indicator of this market's state will suddenly collapse for no reason. Perhaps the forecast value (300-310 thousand) will not be achieved, but what upward movement can provoke such a report? A maximum of 100 points. If the market has not yet had enough of selling the pound, then it will simply "swallow" the unsuccessful report and continue to buy the dollar. No matter how banal it sounds, buying the pound requires waiting until market participants are satisfied with its sales. And it will be possible to determine the moment when this happens only by technical indicators. We do not believe that the market is waiting for a global event (like a meeting of the Fed or the Bank of England) to change its preferences.

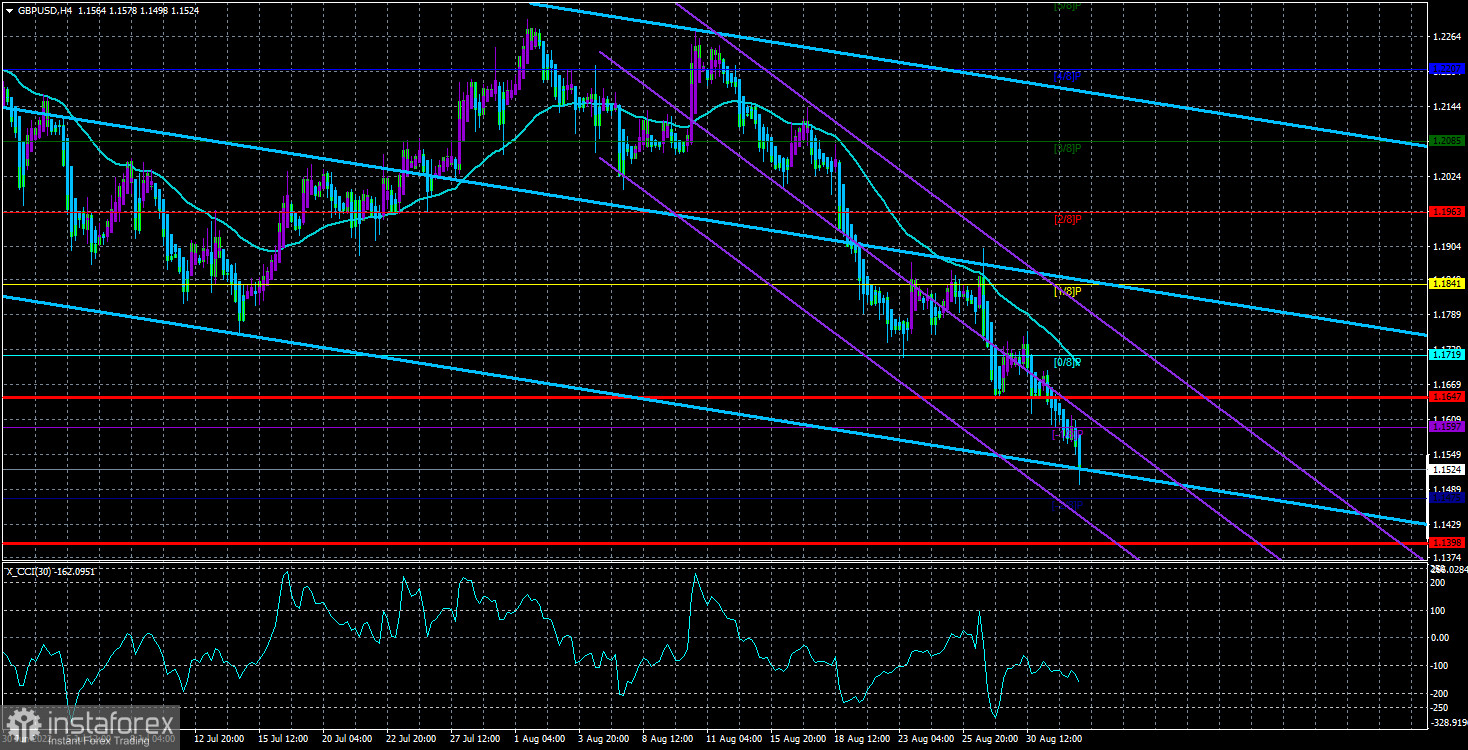
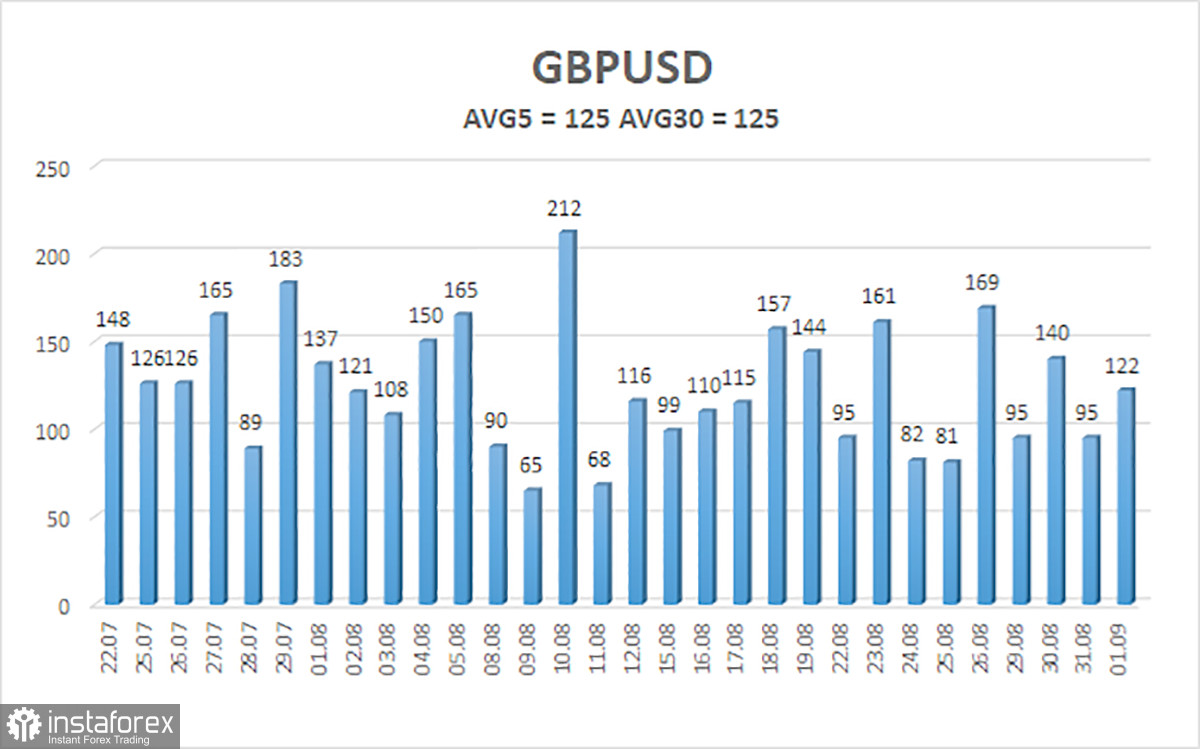
The average volatility of the GBP/USD pair over the last five trading days is 125 points. For the pound/dollar pair, this value is "high." Therefore, on Friday, September 2, we expect movement inside the channel, limited by the levels of 1.1398 and 1.1647. A reversal of the Heiken Ashi indicator upwards will signal a round of upward correction.
Nearest support levels:
S1 – 1.1475
Nearest resistance levels:
R1 – 1.1597
R2 – 1.1719
R3 – 1.1841
Trading Recommendations:
The GBP/USD pair continues its downward movement in the 4-hour timeframe. Therefore, at the moment, you should stay in sell orders with targets of 1.1475 and 1.1398 until the Heiken Ashi indicator turns up. Buy orders should be opened when the price is fixed above the moving average line with targets of 1.1841 and 1.1963.
Explanations of the illustrations:
Linear regression channels – help determine the current trend. If both are directed in the same direction, then the trend is strong.
Moving average line (settings 20.0, smoothed) – determines the short-term trend and the direction in which trading should be conducted now.
Murray levels are target levels for movements and corrections.
Volatility levels (red lines) are the likely price channel in which the pair will spend the next day, based on current volatility indicators.
The CCI indicator – its entry into the oversold area (below -250) or into the overbought area (above +250) means that a trend reversal in the opposite direction is approaching.


