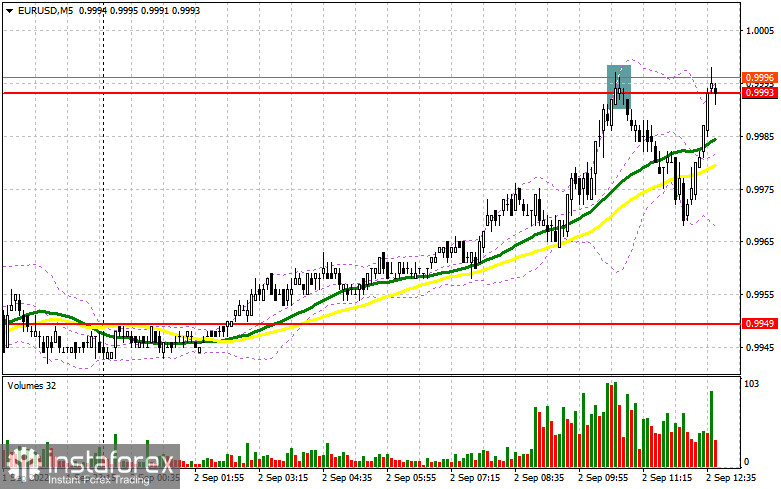
In my previous forecast, I drew your attention to the level of 0.9993 and recommended entering the market from it. Let's have a look at the 5-minute chart and analyze the current situation. The pair rose from that level and formed a false breakout which gave an excellent entry point into short positions. After that, the pair fell by 25 pips but it did not touch the support of 0.9949 due to the weak fundamental data of the European economy.

Long positions on EUR/USD:
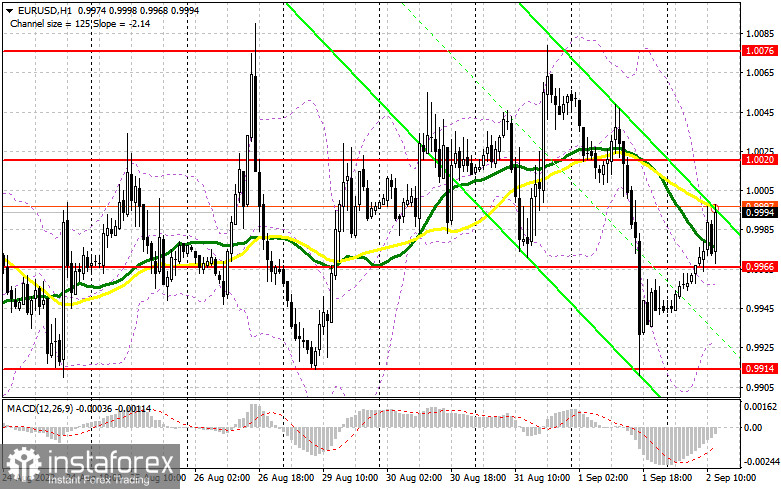
In the second half of the day, investors will be focused on the US labor market data, as the current situation in the market depends on it. Possibly, we will be able to know whether the euro or the US dollar will dominate. The strongly deteriorating US labor market is likely to cause the European currency to rise sharply, as it will dampen expectations that the Federal Reserve will raise the interest rate by 0.75% in September. If we see strong data on the labor market, the euro is likely to fall, though it is unlikely to stay at lows for long. If the pair shows a sharp drop, only a false breakout near the new support of 0.9966, formed during the first half of the day, may create a good entry point into long positions, counting on a return to the high of 1.0020. A breakthrough and a top/bottom test of that level may trigger bears' Stop Loss orders and provide an opportunity to buy the euro above parity. This is likely to open the way to the area of 1.0076. Resistance at 1.0127, where traders could take profits, will be a more distant target. If the EUR/USD pair declines and bulls show weak activity at 0.9966 in the second half of the day, the pressure on the pair will increase, as the upper boundary of the ascending channel of August 23 passes near this range. A false breakout near the low of 0.9914 would be the best opportunity to open long positions. You may buy EUR/USD on the rebound from 0.9861, or lower near 0.9819, allowing an upward intraday correction of 30-35 pips.
Short positions on EUR/USD:
Bears need to protect the resistance at 1.0020. Notably, bulls failed to get a grip above that level yesterday. It is likely that market participants will buy after the US employment data release if it comes out worse than expected. On the contrary, strong statistics and better than economists' expectations job growth will help sellers and the US dollar deal with the recent upward correction. It would be better to open short positions after a false breakout at 1.0020, which is likely to give a sell signal and drag the euro down to 0.9966. A breakthrough, a consolidation below that level, and a reverse bottom/top test may give an additional entry point into short positions counting on the price moving to the area of 0.9914, where traders may generate profits. The next target is located in the area of 0.9861. If the EUR/USD pair increases in the second half of the day and we see weak activity from bears at 1.0020, bulls may take control over the market. In that case, it would be better to postpone opening short positions until the price reaches 1.0076 while forming a false breakout. You may sell the euro on a rebound from the high of 1.0127, or higher from 1.0155, allowing a downward correction of 30-35 pips.

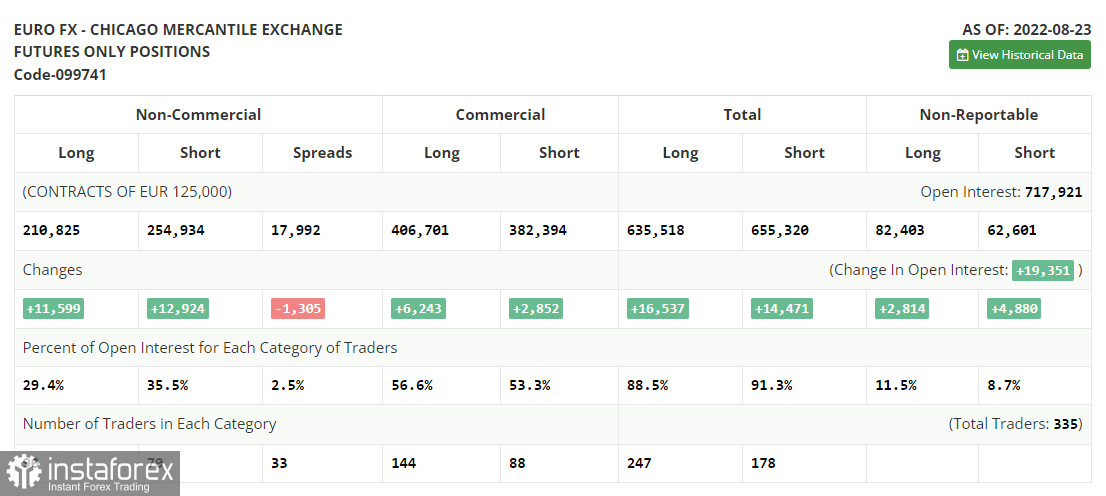
The COT report for August 23 logged a sharp increase in both short and long positions. This indicates a rather high appetite of traders, especially after the euro hit parity against the US dollar. The speech of Fed Chairman Jerome Powell at Jackson Hole led to a surge in volatility and provided temporary support to the US dollar. On the other hand, large players do not want to let the pair go below parity, and each time the pair declines, they act more actively. Jerome Powell said that the Fed would continue to fight inflation at full power and noted that the regulator would keep the same pace of interest rate hikes during the September meeting. However, the markets had priced in that kind of change and the euro did not collapse against the US dollar. This week, it is important to analyze the data on the US labor market. This indicator influences the Fed's plans. A strong labor market is likely to keep inflation high, which will force the central bank to raise interest rates further. The COT report indicated that long non-commercial positions rose by 11,599 to 210,825, and short non-commercial positions jumped by 12,924 to 254,934. At the end of the week, the total non-commercial net position remained negative, falling to -44,109 against -42,784, indicating continued pressure on the euro and a further drop in the trading instrument. The weekly closing price decreased to 0.9978 against 1.0191.

Indicator signals:
Moving averages
The pair is trading near the 30- and 50-day moving averages, indicating an uncertain situation in the market.
Note: Period and prices of moving averages are considered by the author on hourly chart H1 and differ from the common definition of classic daily moving averages on daily chart D1.
Bollinger Bands
If the price declines, the lower boundary of the indicator at 0.9925 will act as support.
Indicators description
- Moving average defines the current trend by smoothing out market volatility and noise. Period 50. Marked in yellow on the chart.
- Moving average defines the current trend by smoothing out market volatility and noise. Period 30. Marked in green on the chart.
- MACD (Moving Average Convergence/Divergence) indicator Fast EMA of period 12. Slow EMA period 26. SMA period 9
- Bollinger Bands. Period 20
- Non-commercial traders are speculators, such as individual traders, hedge funds, and large institutions, which use the futures market for speculative purposes and meet certain requirements.
- Long non-commercial positions represent the total long open position of non-commercial traders.
- Short non-commercial positions represent the total short open position of non-commercial traders.
- Total non-commercial net position is the difference between short and long positions of non-commercial traders.


