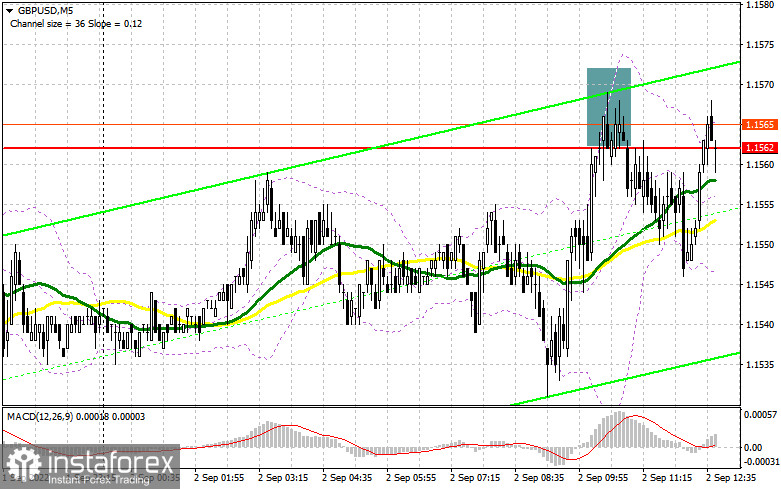
In the morning, the focus was on 1.1562, with entry points considered from this level. Let's look at the 5-minute chart to get a picture of what happened in the market. A sell signal was made after a false breakout at 1.1562. After a 15 pips move, demand for GBP increased. In the second half of the day, the technical picture somewhat changed as well as the strategy.

When to go long on GBP/USD:
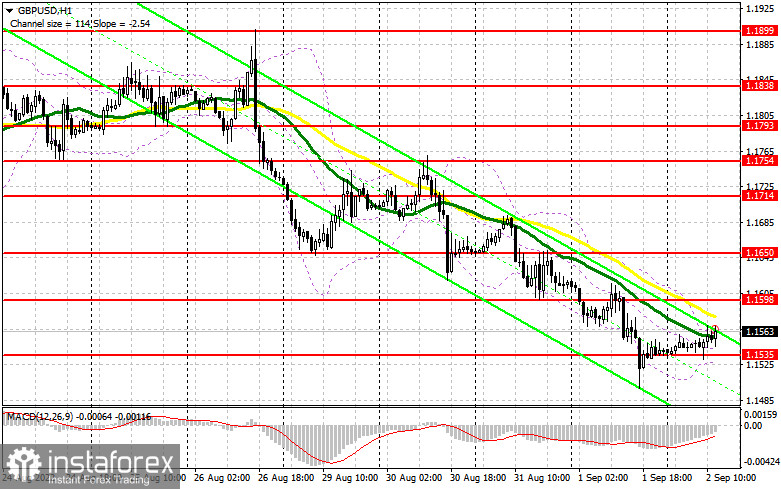
GBP will rise should US jobs market data come disappointing. The currency has been extremely overbought lately. In this light, expectations of a 0.75% rate hike by the Fed in September could somewhat ease. However, if payrolls increase, the pound will fall. In case of a sell-off after the report, bulls should defend 1.1535 support that emerged during the European session. A false breakout through 1.1535 will generate a buy signal with the target at 1.1598 support. Bearish MAs passing slightly below this barrier will limit the pair's upside potential. Bullish power will grow after a breakout and top-bottom retest of the 1.1598 mark, with the target at 1.1650. A more distant target stands at the 1.1714 high, where traders could lock in profits. Should GBP/USD fall with no bullish activity at 1.1535, pressure on GBP will mount. In such a case, it would be wiser to look for long entry points after a false breakout through the 1.1473 low. Long positions could also be opened on a bounce from 1.1409, the low of 2020, allowing a 30-35 pips intraday correction.
When to go short on GBP/USD:
Bears did everything they could in the first half of the day. Hardly anyone wishes to sell the instrument at yearly lows. If payroll data comes much worse than expected, the price may soar to 1.1598 resistance. After a false breakout through the barrier, the volume of short positions will increase, and the price will break through 1.1535 support, which emerged during the European session. A breakout and bottom-top retest of the 1.1535 mark will create a sell signal with the target at 1.1473, where traders could lock in profits. A more distant target is seen at around 1.1409. If GBP/USD shows growth and there is no bearish activity at 1.1598, a bullish correction could occur. In such a case, short positions could be opened after a false breakout through 1.1650 or on a bounce from 1.1714 or 1.1754, allowing a 30-35 pips downward correction intraday.

Commitments of Traders:
The COT report from August 23 logs an increase both in short and long positions. Although the number of longs exceeds shorts, it does not affect the current market sentiment. GBP/USD remains under serious pressure in light of the recent remarks by Fed's Chairman Jerome Powell. He said the central bank would go on with aggressive rate hikes. Due to rising inflation expectations and soaring costs of living in the UK, traders can barely open new long positions because a series of disappointing fundamentals are expected ahead. This data is likely to push the sterling even below the levels it is trading at now. This week the focus is on US nonfarm payrolls. This report will be the key to the Federal Reserve's decision on monetary policy. The sustainable jobs market with unemployment at historic lows will cause additional inflationary pressure in the future and force the Fed to continue hiking rates. In light of the hawkish Fed, risk assets, including GBP, would come under pressure. According to the latest COT report, long non-commercial positions grew by 14,699 to 58,783, and short non-commercial positions climbed by 9,556 to 86,749. The negative value of non-commercial net positions decreased to -27,966 against -33,109 a week ago. GBP/USD plunged to 1.1822 from 1.2096 in the previous week.
Indicator signals:
Moving averages
Trading is carried out below the 30-day and 50-day moving averages, showing bearish GBP.
Note: The period and prices of moving averages are viewed by the author on the hourly chart and differ from the general definition of classic daily moving averages on the daily chart.
Bollinger Bands
Resistance and support are seen at 1.1571 and 1.1530 in line with the upper band and lower bands respectively.
Indicator description:
- Moving average (MA) determines the current trend by smoothing volatility and noise. Period 50. Colored yellow on the chart.
- Moving average (MA) determines the current trend by smoothing volatility and noise. Period 30. Colored green on the chart.
- Moving Average Convergence/Divergence (MACD). Fast EMA 12. Slow EMA 26. SMA 9.
- Bollinger Bands. Period 20
- Non-commercial traders are speculators such as individual traders, hedge funds, and large institutions who use the futures market for speculative purposes and meet certain requirements.
- Long non-commercial positions are the total long position of non-commercial traders.
- Non-commercial short positions are the total short position of non-commercial traders.
- Total non-commercial net position is the difference between short and long positions of non-commercial traders.


