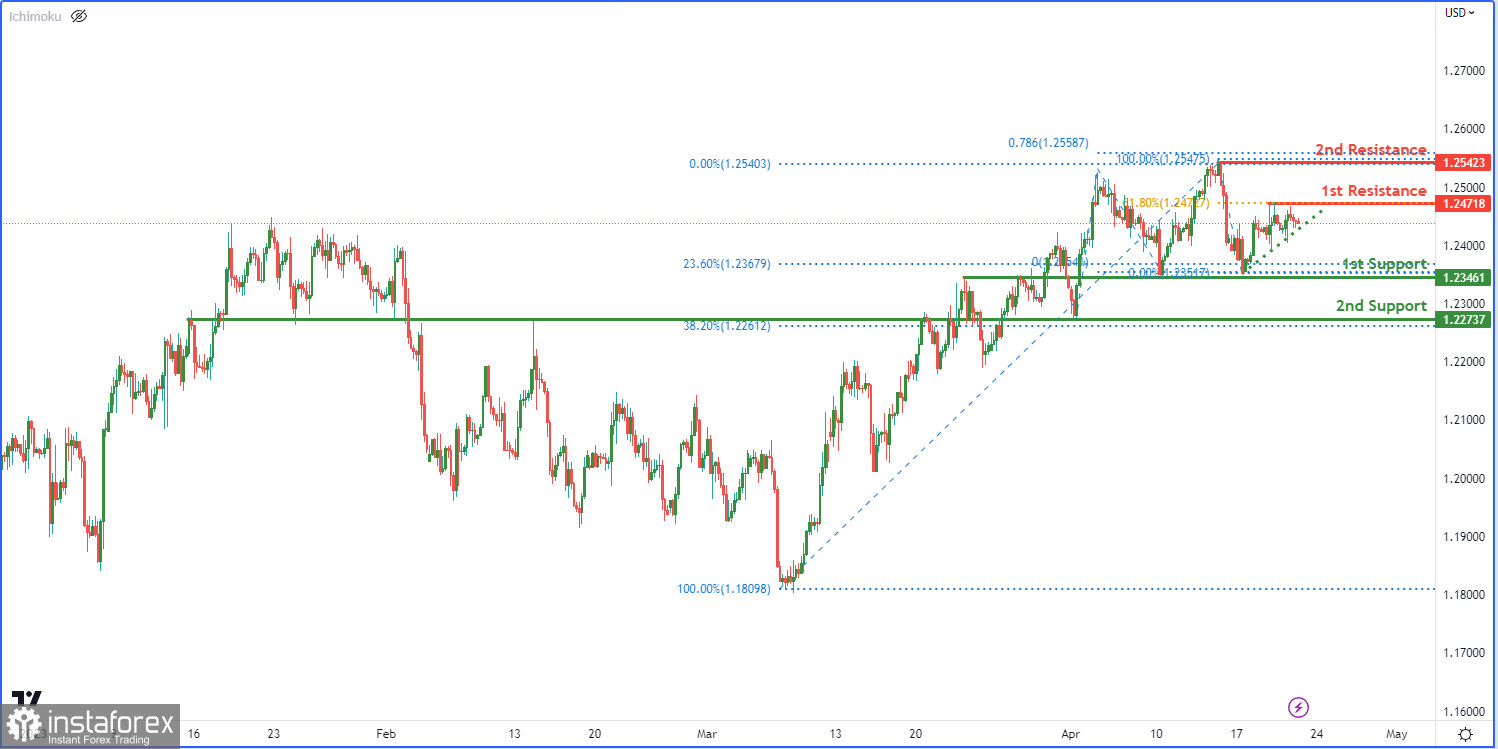
The GBP/USD chart currently shows a strong bullish momentum with price trading above a major ascending trend line and an ascending trend line which acts as support. This indicates the potential for further bullish momentum in the future.
The 1st support is located at 1.2346, which is an overlap support and coincides with a 23.6% Fibonacci retracement, making it a strong potential support level if price bounces from this level. The 2nd support is at 1.2273, another overlap support which lines up with a 38.2% Fibonacci retracement.
On the resistance side, the 1st resistance level is at 1.2471, which is a multi-swing high resistance level. If price breaks through this level, it could potentially rise towards the 2nd resistance at 1.2542. This level is a swing high resistance and is also in line with the 78.6% Fibonacci projection, making it a significant resistance level


