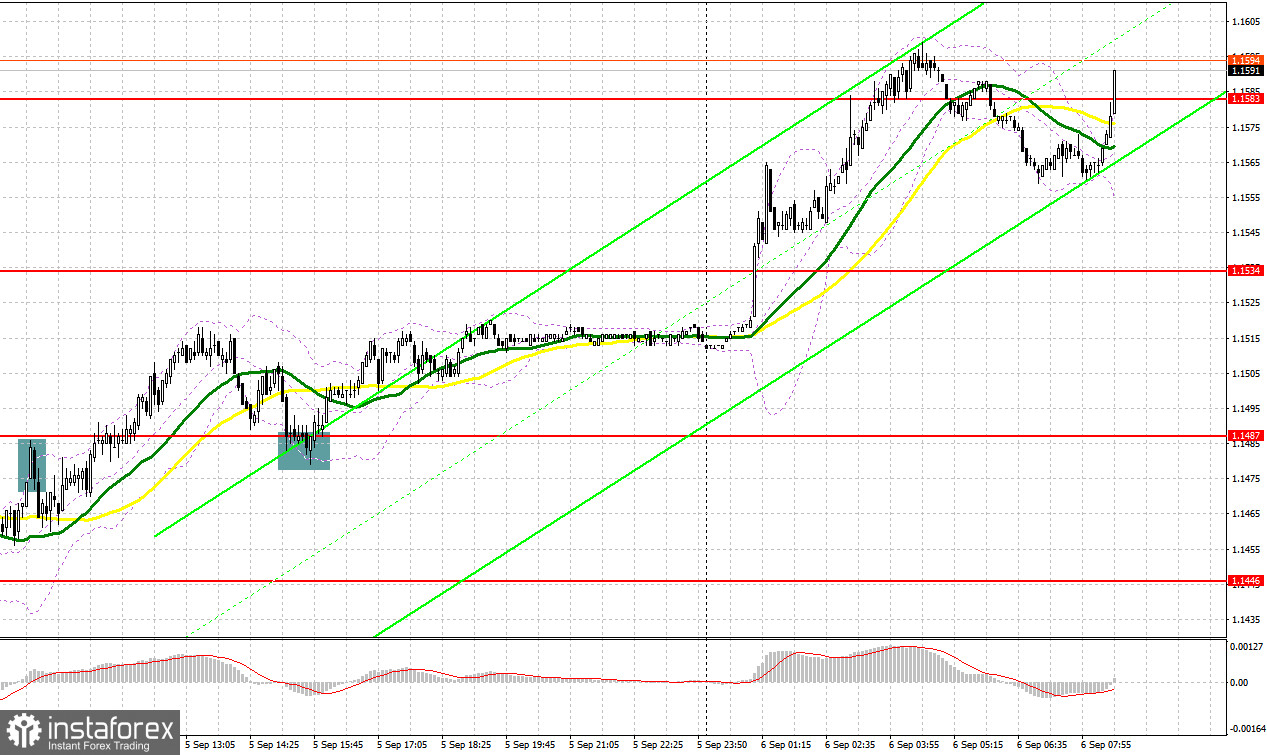
Several market entry signals were formed yesterday, but not all of them were profitable. Let's take a look at the 5-minute chart and figure out what happened. I paid attention to the 1.1476 level in my morning forecast and advised making decisions on entering the market from it. Growth and forming a false breakout at 1.1476 there - all this led to a sell signal, which was not realized to the proper extent. The bears tried to keep the pair below this level a few more times, but in the end they accepted defeat, which led to the removal of stop orders and consolidating losses. A new signal to buy the pound was formed only in the afternoon, after a reverse test of 1.1487 from top to bottom, which eventually brought about 25 points of profit, which made it possible to cover past losses and earn some money.

COT report:
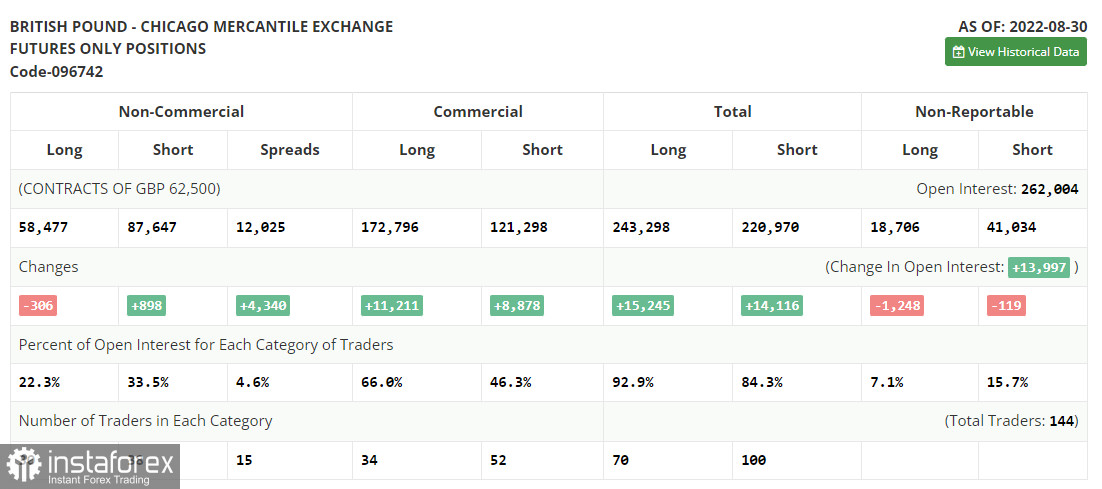
Before analyzing the technical picture of the pound, let's look at what happened in the futures market. An increase in short positions was recorded in the Commitment of Traders (COT) report for August 30, while long ones decreased. This once again confirms the fact that the British pound is in a major downward peak. Serious pressure on the pair will continue in the future, as the British economy is getting worse and worse, and GDP is shrinking quite quickly. The choice of a new prime minister of Great Britain will only provide temporary support to the pound, since, in fact, it does not change anything. In turn, the US economy continues to show strength, and recent data on the labor market once again convinced investors that the US central bank, led by Federal Reserve Chairman Jerome Powell, will continue to raise interest rates at an aggressive pace, which will only increase pressure on the British pound, which is experiencing quite a lot of problems lately. Expected high inflation and a looming cost-of-living crisis in the UK does not give traders room to take long positions, as a fairly large range of weak fundamentals is expected ahead, likely to push the pound even further below the levels at which it is currently trading. The latest COT report indicated that long non-commercial positions decreased by 306 to 58,477, while short non-commercial positions rose by 898 to 86,647, which led to a slight increase in the negative value of the non-commercial net position to -29,170 vs. -27,966. The weekly closing price collapsed from 1.1661 against 1.1822.

When to go long on GBP/USD:
Today we have almost no data on the UK, except for the report on the index of business activity in the construction sector from IHS Markit, which is unlikely to seriously affect the pound's volatility in the short term. Much will depend on the disposition of traders to risky assets after the announcement of the new prime minister of Great Britain, which became Foreign Minister Lisa Truss. In the near future, the reforms proposed by her may determine the further direction of the pair, since nothing good can be expected from the Bank of England. The defeat of Finance Minister Rishi Sunak speaks for itself.
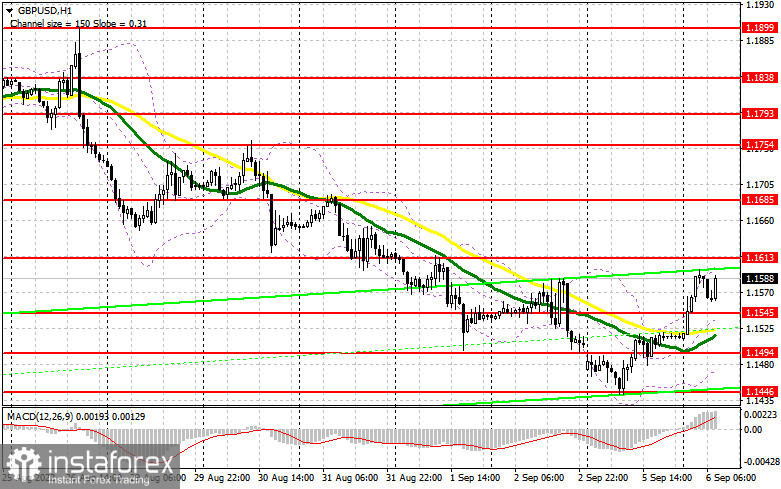
In case GBP/USD falls in the first half of the day after the reaction to the negative data on the UK, which is quite likely, the best scenario for buying will be a false breakout in the area of the nearest support at 1.1545, formed on the basis of yesterday. There are also moving averages, playing on the bulls' side. This will lead to a bounce up and a push to the 1.1613 area. We can only talk about the prerequisites for building a new upward correction for the pair after getting above this range. A breakdown of 1.1613, as well as a reverse downward test will open the way to 1.1685. A more distant target will be the area of 1.1754, where I recommend taking profits.
If the GBP/USD falls and there are no bulls at 1.1545, the pressure on the pound will increase again, which will force the bulls to leave the market again, as the risk of further development of the bearish trend will become more real. If this happens, I recommend postponing long positions to 1.1494. I advise you to buy there only on a false breakout. You can open long positions on GBP/USD immediately for a rebound from 1.1446, or in the area of the low of 2020 at 1.1402, counting on correcting 30-35 points within the day.
When to go short on GBP/USD:
Protecting the nearest resistance at 1.1613 is almost the most important task for today. Strong fundamental reports will help. In case the pair rises, forming a false breakout at 1.1613 will return pressure on the pound and form a sell signal in order to develop a further bearish trend and decline to the nearest support at 1.1545. This event will also keep the pair in a short-term horizontal channel with a lower boundary near the annual low, which will limit the pair's upward potential. A breakthrough and reverse test from the bottom up at 1.1545 will provide an entry point for short positions with a fall to a low of 1.1494. A more distant target will be the area of 1.1446, where I recommend taking profits.
In case GBP/USD grows and the bears are not active at 1.1613, the situation will completely get out of the bears' control, and bulls will have an excellent chance of returning to 1.1685. Only a false breakout around 1.1685 creates an entry point into short positions, counting on a new downward movement of the pair. If traders are not active there, there may be a surge up to a high of 1.1754. There, I advise you to sell GBP/USD immediately for a rebound, based on a rebound of the pair down by 30-35 points within the day.

Indicator signals:
Trading is carried out above 30 and 50 moving averages, which leaves a chance for bears to further pull down the pair.
Moving averages
Note: The period and prices of moving averages are considered by the author on the H1 hourly chart and differs from the general definition of the classic daily moving averages on the daily D1 chart.
Bollinger Bands
A breakthrough of the lower border of the indicator in the area of 1.1480 will increase pressure on the pair. If the pair grows, the upper border of the indicator around 1.1610 will act as resistance.
Description of indicators
- Moving average (moving average, determines the current trend by smoothing out volatility and noise). Period 50. It is marked in yellow on the chart.
- Moving average (moving average, determines the current trend by smoothing out volatility and noise). Period 30. It is marked in green on the chart.
- MACD indicator (Moving Average Convergence/Divergence — convergence/divergence of moving averages) Quick EMA period 12. Slow EMA period to 26. SMA period 9
- Bollinger Bands (Bollinger Bands). Period 20
- Non-commercial speculative traders, such as individual traders, hedge funds, and large institutions that use the futures market for speculative purposes and meet certain requirements.
- Long non-commercial positions represent the total long open position of non-commercial traders.
- Short non-commercial positions represent the total short open position of non-commercial traders.
- Total non-commercial net position is the difference between short and long positions of non-commercial traders.


