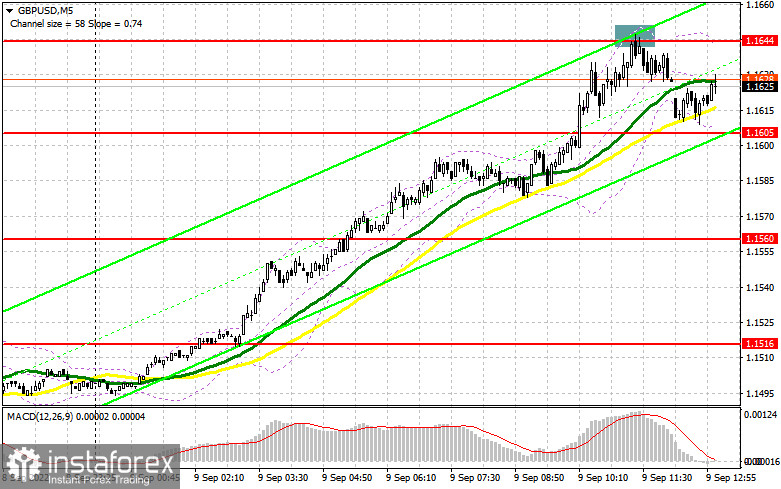
In the morning review, I turned your attention to 1.1644 and recommended making decisions with this level in focus. Let's analyze the 5-minute chart and try to figure out what actually happened. After a breakout of the 1.600 level and a sharp rise of the pound/dollar pair, the bulls managed to push the pair to a high of 1.1644. A false breakout of this level gave an excellent sell signal. At the time of writing the article, the pair sank by more than 40 pips. For the second half of the day, the technical outlook was partially revised as was the trading strategy

Conditions for opening long positions on GBP/USD
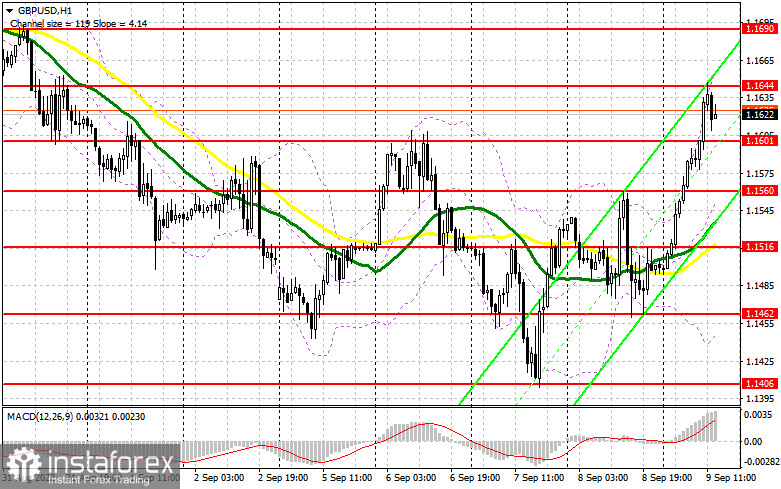
As I have already mentioned above, the bulls accomplished their goal. So, it's time for bears to assert strength. They were pushing the pair down at the time of writing the article. There will be no economic reports in the afternoon that could trigger a surge in volatility. Therefore, it would be wise to close so Take Profit orders on long positions at the end of the week. Today, only the US Wholesale Inventories report is due. Fed policymakers Charles Evans, Christopher Waller, and Easter George are going to deliver speeches. The latter adheres to a softer approach to raising interest rates. If the pound sterling declines, pay attention to the new support level of 1.1601, formed in the first half of the day. It is better to open long positions at this level only if a false breakout occurs. If this scenario is correct, a correction to the weekly high of 1.1644 may take place. A breakout and a downward test of this level along with weak US data will help bulls regain ground. The pair could climb 1.1690. A more distant target will be a high of 1.1754 where I recommend locking in profits. If GBP/USD falls and bulls show no activity at 1.1601, the pressure on the pound sterling will escalate once again. Hence, the pair could return to the sideways channel. If so, sellers are sure to take the upper hand. Below this level, a low of 1.1560 is located. I would advise opening long positions only if a false breakout occurs. You can buy GBP/USD at a bounce from 1.1516 or a low of 1.1462, keeping in mind an upward intraday correction of 30-35 pips.
Conditions for opening short positions on GBP/USD
The bears grabbed the chance and pushed the pair down. In order to regain control, the pair should close the week below 1.160. Focus your attention on this level in the afternoon. I would like to see another entry point into short positions from the 1.1644 level similar to the one I mentioned above. A breakout and an upward test of 1.1601 will provide an excellent sell signal. As a result, the pair could drop to 1.1560 where I recommend locking in profits. A more distant target will be the 1.1516 level where the moving averages are passing in positive territory. If GBP/USD rises and bears show no energy at 1.1644, bulls will have a chance to start an upward correction. If so, it is better to postpone short positions until a false breakout of a new high of 1.1690 takes place. It will generate a sell signal. You can sell GBP/USD at a bounce from 1.1754 or even a high of 1.1793, keeping in mind a downward intraday correction of 30-35 pips.

COT report
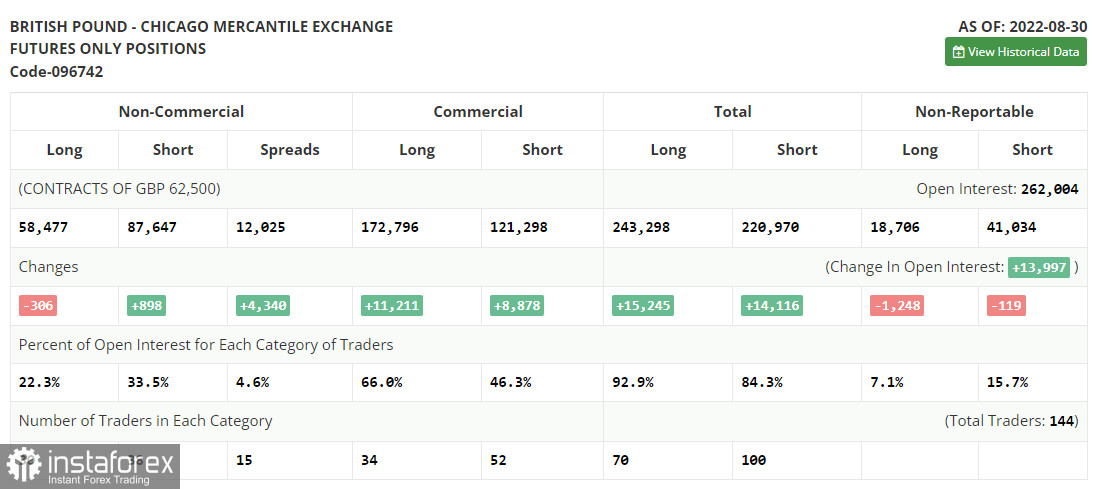
The CAT report (Commitment of Traders) for August 30 logged an increase in short positions and a drop in long ones. It proves the fact that the pound sterling is in the bears' claws. GBP/USD will remain under pressure in the future because the UK economy is dealing with internal headwinds. The UK GDP has been shrinking. The election of the new Prime Minister will provide the pound sterling only with short-term support because a new politician at the helm of the British government will hardly improve the economic situation. The US economy, on the contrary, remains resilient. The latest US Nonfarm payrolls assured investors that the Fed would stick to aggressive tightening. This will escalate pressure on the pound sterling which has been facing strong bearish pressure due to the worsening economy. Traders are unwilling to buy the pound sterling because of high inflation expectations and the looming crisis of the living cost in the UK. A series of weak fundamental reports will follow ahead. So, the pound sterling is likely to decline below the current levels. According to the last COT report, the number of long non-commercial positions dropped by 306 to 58,477 whereas the number of short positions grew by 898 to 86,647. It led to a minor increase in the negative non-commercial net positions to -29,170 against -27,966. GBP/USD closed on Friday much lower at 1.1661 versus 1.1822 a week ago.

Indicators' signals:
Trading is carried out above the 30 and 50 daily moving averages. It means that bulls do not give up an attempt to start an upward correction.
Moving averages
Note: The period and prices of moving averages are considered by the author on the H1 hourly chart and differ from the general definition of the classic daily moving averages on the daily D1 chart.
Bollinger Bands
If GBP/USD declines, the indicator's lower border at 1.1450 will serve as support.
Description of indicators
- Moving average (moving average, determines the current trend by smoothing out volatility and noise). Period 50. It is marked yellow on the chart.
- Moving average (moving average, determines the current trend by smoothing out volatility and noise). Period 30. It is marked green on the chart.
- MACD indicator (Moving Average Convergence/Divergence — convergence/divergence of moving averages) Quick EMA period 12. Slow EMA period to 26. SMA period 9
- Bollinger Bands (Bollinger Bands). Period 20
- Non-commercial speculative traders, such as individual traders, hedge funds, and large institutions use the futures market for speculative purposes and meet certain requirements.
- Long non-commercial positions represent the total long open position of non-commercial traders.
- Short non-commercial positions represent the total short open position of non-commercial traders.
- Total non-commercial net position is the difference between short and long positions of non-commercial traders.


