


Long-term perspective.
The EUR/USD currency pair has increased by 90 points during the current week. This is all you need to know now about the prospects of the European currency. Even after the ECB raised its rates for the second time in a row (by 0.75% at once) and Christine Lagarde promised to continue tightening monetary policy at a high pace, the European currency did not experience a surge of optimism and continues to trade near its 20-year lows. In principle, this week's key event was the ECB meeting. There was also a speech by Jerome Powell and the publication of the ISM index in the service sector, but these data were secondary. The ISM index surprised again, having increased compared to the previous month, while the similar S&P index continues its fall below the "waterline." Jerome Powell did not tell traders anything fundamentally new or important, so there was nothing to react to.
As a result, for the second half of the week, the market was impressed by the ECB's unexpected "hawkish" mood. Recall that the ECB has been "pulling the rubber" for a long time, not daring to start raising the rate. Inflation, meanwhile, was rising. And then suddenly, for no reason, the European regulator raised rates twice by a total of 1.25%. Moreover, he intends to continue raising the rate at a rate of 0.5-1.00% at subsequent meetings in 2022. Therefore, by the end of the year, the ECB rate may be as close as possible to the Fed rate, as the pace of tightening in America will slowly begin to decline in the coming months. From our point of view, this fact can benefit the position of the euro. The divergence between the ECB and Fed rates will gradually decrease, which may cause the strengthening of the euro currency, which has fallen mercilessly in recent months. However, this does not mean that the downward trend has already been completed. There is still no single signal in the 24-hour timeframe that would indicate a new trend. The price is located below all the lines of the Ichimoku indicator.
COT analysis.
The COT reports on the euro currency in the last few months reflect what is happening in the euro/dollar pair. For half of 2022, they showed a frank "bullish" mood of professional players, but at the same time, the European currency was steadily falling. The situation is different, but it no longer favors the euro currency. If earlier the mood was "bullish" and the euro currency was falling, now the mood is "bearish," and the euro currency is also falling. Therefore, we do not see any reason for the growth of the euro because the absolute majority of factors remain against it. During the reporting week, the number of buy contracts from the "Non-commercial" group increased by 3 thousand, and the number of shorts decreased by 8.3 thousand. Accordingly, the net position increased by about 12 thousand contracts. This is not very much, but it is still weakening the "bearish" mood among the major players. However, this fact does not matter much since the mood remains "bearish," and the euro remains "at the bottom." Professional traders still do not believe in the euro currency. The number of buy contracts is lower than that of sell contracts for non-commercial traders by 36 thousand. Therefore, we can state that the demand for the US dollar is high, and the demand for the euro is quite low. The fact that major players are in no hurry to buy euros may lead to a new depreciation of this currency. Over the past six months or a year, the euro currency has not been able to show even a tangible correction.
Analysis of fundamental events.
There were few macroeconomic statistics in the European Union this week. The index of business activity in the service sector and the composite index went below the level of 50.0, retail sales in July were generally in line with forecasts, and the final value of GDP for the second quarter was 0.8%. From our point of view, the euro currency could demonstrate stronger growth than 90 points. After all, the economy in the EU is growing now, despite all the fears of a possible "gas crisis," so again, it turns out quite illogical. If there are no reasons to buy euros, traders are happy to sell them. If there is, then either very weak purchases follow, or there are no such purchases. Thus, the euro currency has failed to reverse the downward trend, as market participants refuse to buy it. If this situation continues, the euro will not expect anything good in the near future.
The trading plan for the week of September 12–16:
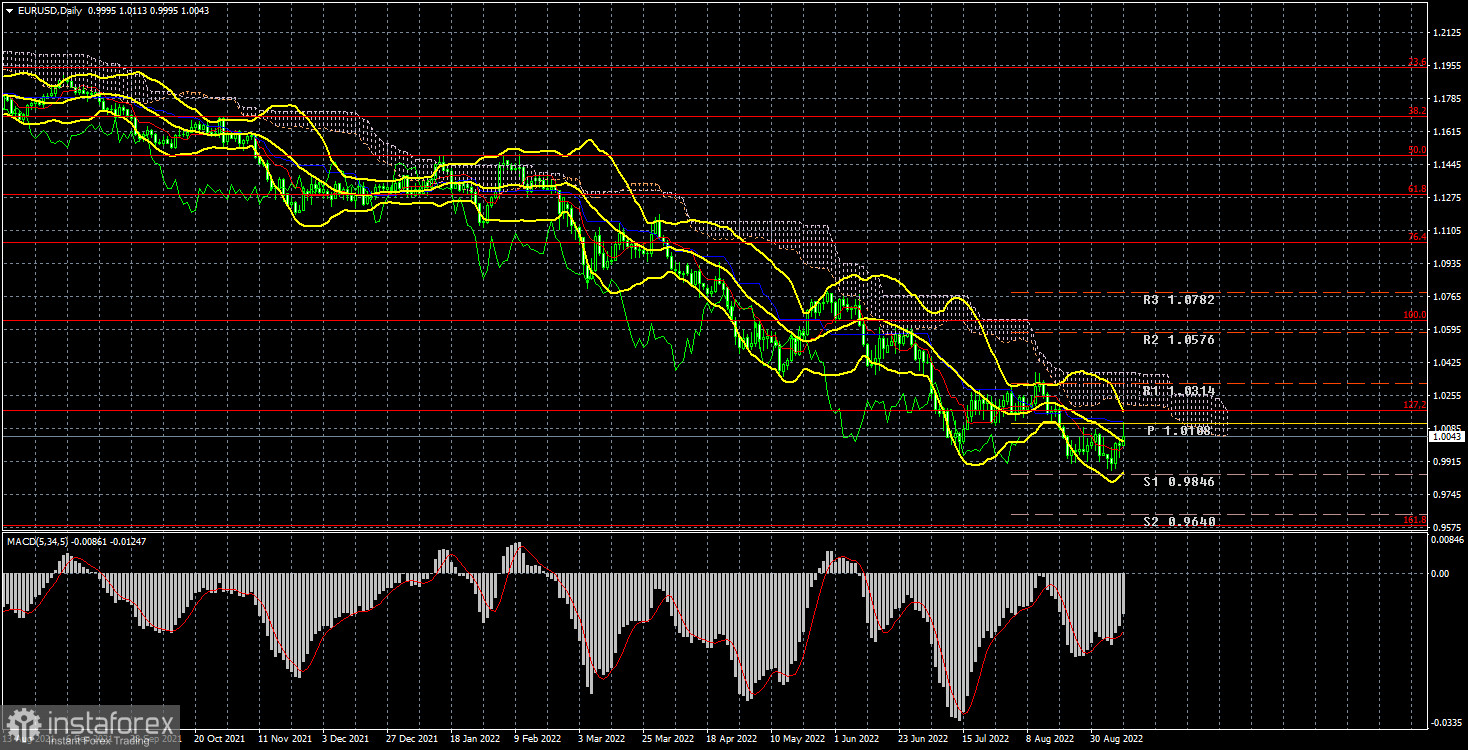
1) In the 24-hour timeframe, the pair continues to move south. Almost all factors still support the long-term growth of the US dollar, although euro support factors are beginning to appear. The price is below the Ichimoku cloud and the critical line, so purchases are still not relevant now. To do this, you must wait at least for consolidation above the Senkou Span B line and only consider long positions.
2) The sales of the euro/dollar pair are still more relevant now. The price is located below the critical line, so we expect the fall to continue with a target of 0.9582 (161.8% Fibonacci). In the future, if the fundamental background for the euro currency does not improve and geopolitics deteriorates, the euro currency may fall even lower.
Explanations of the illustrations:
Price levels of support and resistance (resistance /support), Fibonacci levels – levels that are targets when opening purchases or sales. Take Profit levels can be placed near them.
Ichimoku indicators (standard settings), Bollinger Bands (standard settings), MACD (5, 34, 5).
Indicator 1 on the COT charts is the net position size of each category of traders.
Indicator 2 on the COT charts is the net position size for the "Non-commercial" group.


