


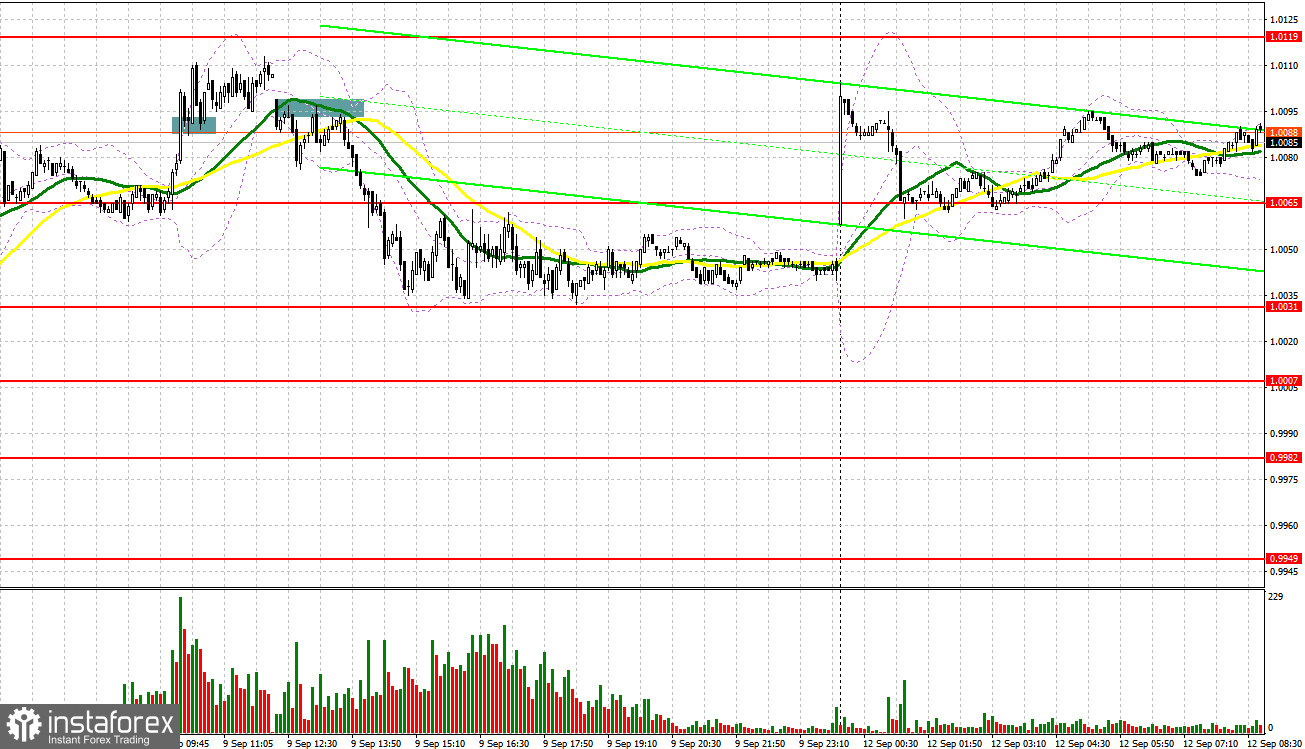
Several market entry signals were formed last Friday. Let's take a look at the 5-minute chart and see what happened. I paid attention to the 1.0094 level in my morning forecast and advised making decisions on entering the market from it. The euro continued its gains during the European session after the European Central Bank's decision a day earlier to raise interest rates while maintaining further hawkish attitude towards monetary policy. The downward breakthrough and reverse test of 1.0094 provided an excellent entry point for long positions, but after a 15-point surge, buying activity dropped sharply. A return below this level and a reverse downward test led to a sell signal, which resulted in the pair falling by more than 50 points.
When to go long on EUR/USD:
The demand for the euro returned in today's Asian session, which allows us to count on the renewal of last week and this month's high above 1.0102. Given that there are no important fundamental statistics, most likely the bulls will cope with this task. The only thing I would pay attention to is the speeches of the ECB representatives. Considering the position even dovish politicians are now taking, their statements are unlikely to seriously harm the prospects for a recovery in the euro. In case the euro falls, the best scenario for buying will be a false breakout in the new support area of 1.0070, formed on the basis of last Friday. This will provide an excellent entry point, counting on the continuation of the upward correction with the nearest target at 1.0102. Statements by ECB representatives may also help the euro if it continues to aggressively raise interest rates. A breakthrough and downward test of 1.0102 will hit the bears' stop orders, which will create another signal to open long positions with the possibility of a correction to the 1.0138 area. A more distant target will be resistance at 1.0185, where I recommend taking profits.
If the EUR/USD declines and there are no bulls at 1.0070, the pair will be under pressure again, but there is no need to panic. The optimal solution for opening long positions in this case would be a false breakout near the low of 1.0039, where the moving averages are, playing on the bulls' side. I advise you to buy EUR/USD immediately on a rebound only from the parity of 1.0001, or even lower - in the area of 0.9982, counting on an upward correction of 30-35 points within the day.
When to go short on EUR/USD:
The bears fought back last Friday, but this was only a pretext for building up long positions in today's Asian session. The bears' main task for today is to protect the nearest resistance at 1.0102, just above which a divergence may form on the MACD indicator, which, together with a false breakout, will lead to an excellent entry point for short positions with the goal of moving the euro down to 1.0070. A breakdown and consolidation below this range with a reverse test from the bottom up creates another sell signal already with the removal of bulls' stop orders and a larger drop in the pair to the 1.0039 area, where the moving averages are passing. I recommend taking profit there. A more distant target will be 1.0001, where in my opinion larger players should enter the market.
In case EUR/USD jumps during the European session, as well as the absence of bears at 1.0102, the upward correction will only intensify. In this scenario, I recommend postponing short positions to 1.0138, but only if a false breakout is formed there. You can sell EUR/USD immediately for a rebound from the high of 1.0185, or even higher - from 1.0221, counting on a downward correction of 30-35 points.
COT report:
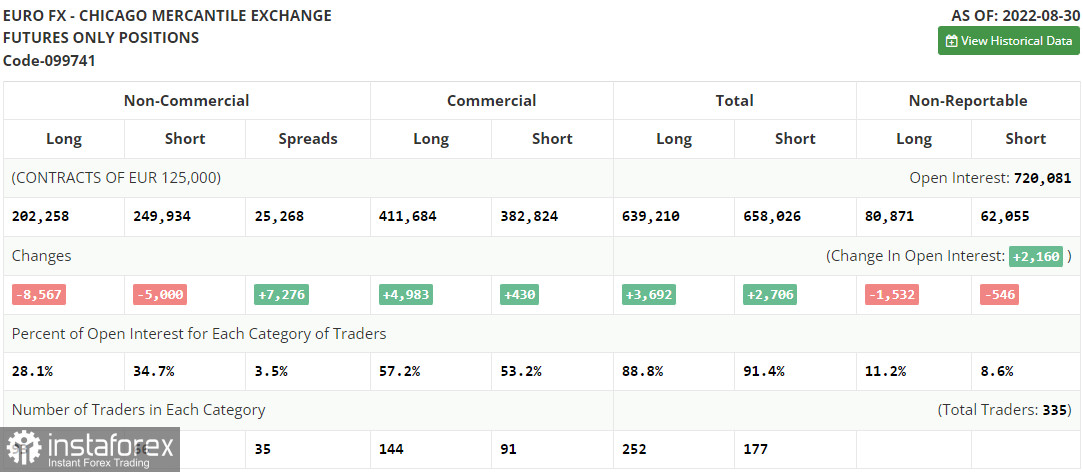
The Commitment of Traders (COT report) for August 30 logged a decline in both short and long positions. If a week ago there was a surge in activity, now there has been a similar decline. This indicates a decrease in investor appetite for risk after the release of the eurozone inflation data, which once again rose to a high in the last ten years. The problem is exacerbated by the energy crisis, as the flow of gas through the Nord Stream is practically suspended - this is another increase in energy prices in the winter and upward inflation surges, which will force the European Central Bank to further raise interest rates and tighten belts. This week we are also waiting for the central bank's decision on interest rates, which may aggravate the euro's position against the US dollar. Even though the rate hike will be considered by investors as a signal for the growth of profitability, at the same time there will be a slowdown in economic growth, which is more important. So don't expect a serious euro recovery in the medium term. The COT report indicated that long non-commercial positions decreased by 8,567 to 202,258, while short non-commercial positions decreased by 5,000 to 249,934. At the end of the week, the total non-commercial net position remained negative and decreased to the level of -47,676 against -44,109, which indicates continued pressure on the euro and further fall of the trading instrument. The weekly closing price slightly recovered and amounted to 1.0033 against 0.9978.
Indicator signals:
Moving averages
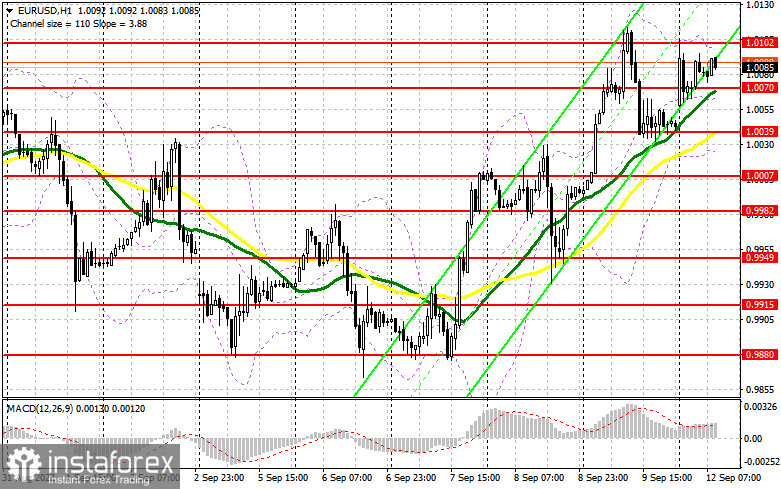
Trading is conducted above the 30 and 50-day moving averages, which indicates an upward correction in the pair.
Note: The period and prices of moving averages are considered by the author on the H1 hourly chart and differs from the general definition of the classic daily moving averages on the daily D1 chart.
Bollinger Bands
In case of a decline, the lower border of the indicator around 1.0025 will act as support. In case of growth, the upper border of the indicator in the area of 1.0102 will act as resistance.
Description of indicators
- Moving average (moving average, determines the current trend by smoothing out volatility and noise). Period 50. It is marked in yellow on the chart.
- Moving average (moving average, determines the current trend by smoothing out volatility and noise). Period 30. It is marked in green on the chart.
- MACD indicator (Moving Average Convergence/Divergence — convergence/divergence of moving averages) Quick EMA period 12. Slow EMA period to 26. SMA period 9
- Bollinger Bands (Bollinger Bands). Period 20
- Non-commercial speculative traders, such as individual traders, hedge funds, and large institutions that use the futures market for speculative purposes and meet certain requirements.
- Long non-commercial positions represent the total long open position of non-commercial traders.
- Short non-commercial positions represent the total short open position of non-commercial traders.
- Total non-commercial net position is the difference between short and long positions of non-commercial traders.


