


Analysis of Monday's deals:
30M chart of the EUR/USD pair
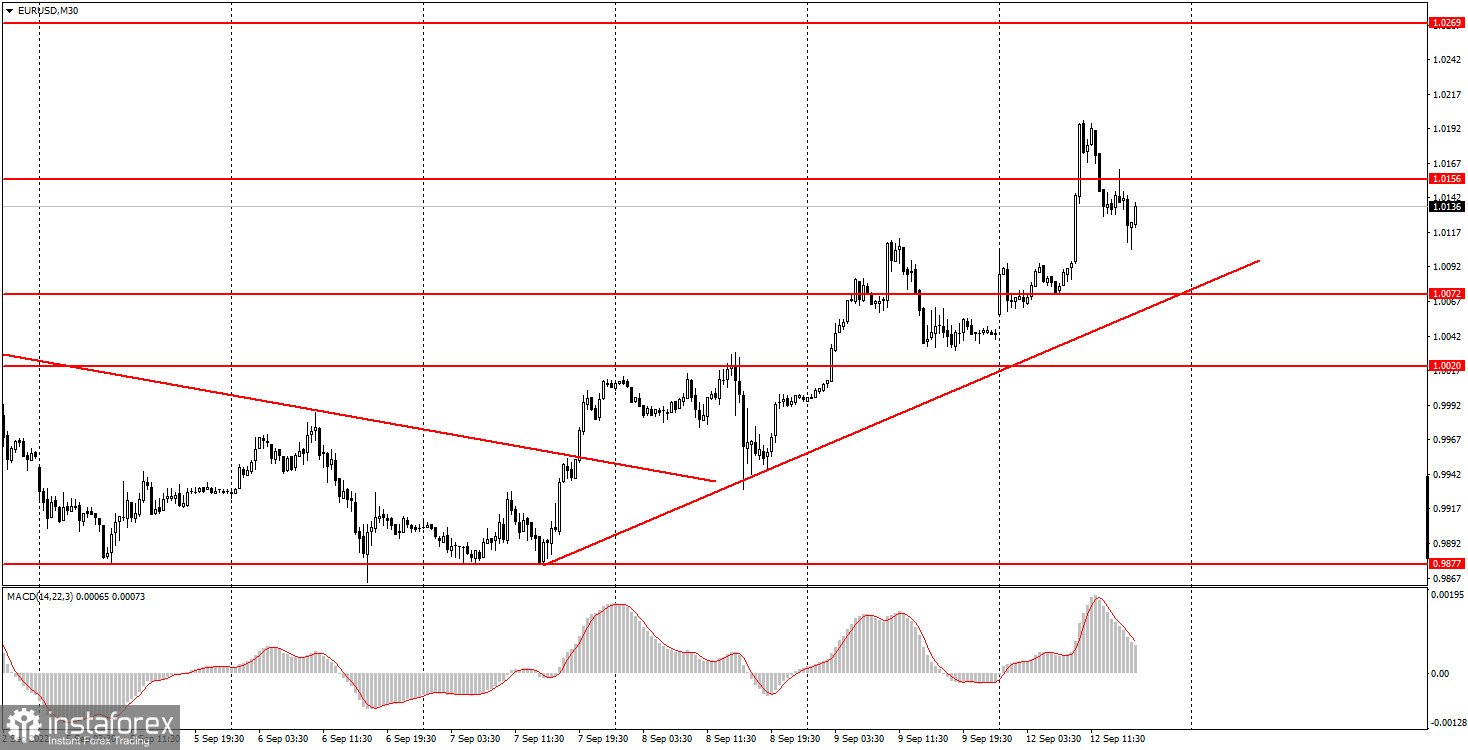
The EUR/USD currency pair continued to develop Friday's success. Recall once again: the European Central Bank last Thursday decided to raise its key rate by 0.75%, so the strengthening of the euro, which followed this, may be a direct consequence of this decision. But, on the other hand, the euro managed to fall today and thoroughly. Of course, the growth was stronger, but the quotes still fell in the afternoon. The volatility of the day was about 150 points, which is very unusual for an "empty Monday", because today there was not a single important macroeconomic event either in the US or in the European Union. What we do have, however, is an ascending trendline that supports the current upward trend. And as long as the price is above it, the upward movement is maintained. Therefore, now it is more appropriate to buy the euro/dollar pair. It is difficult for us to predict how long the euro's growth will continue, since so far only the ECB's decision to raise the rate is behind it. Obviously it won't last forever. We believe that the pair may go up another 100-150 points, and then the question of resuming the downward trend will become very serious.
5M chart of the EUR/USD pair
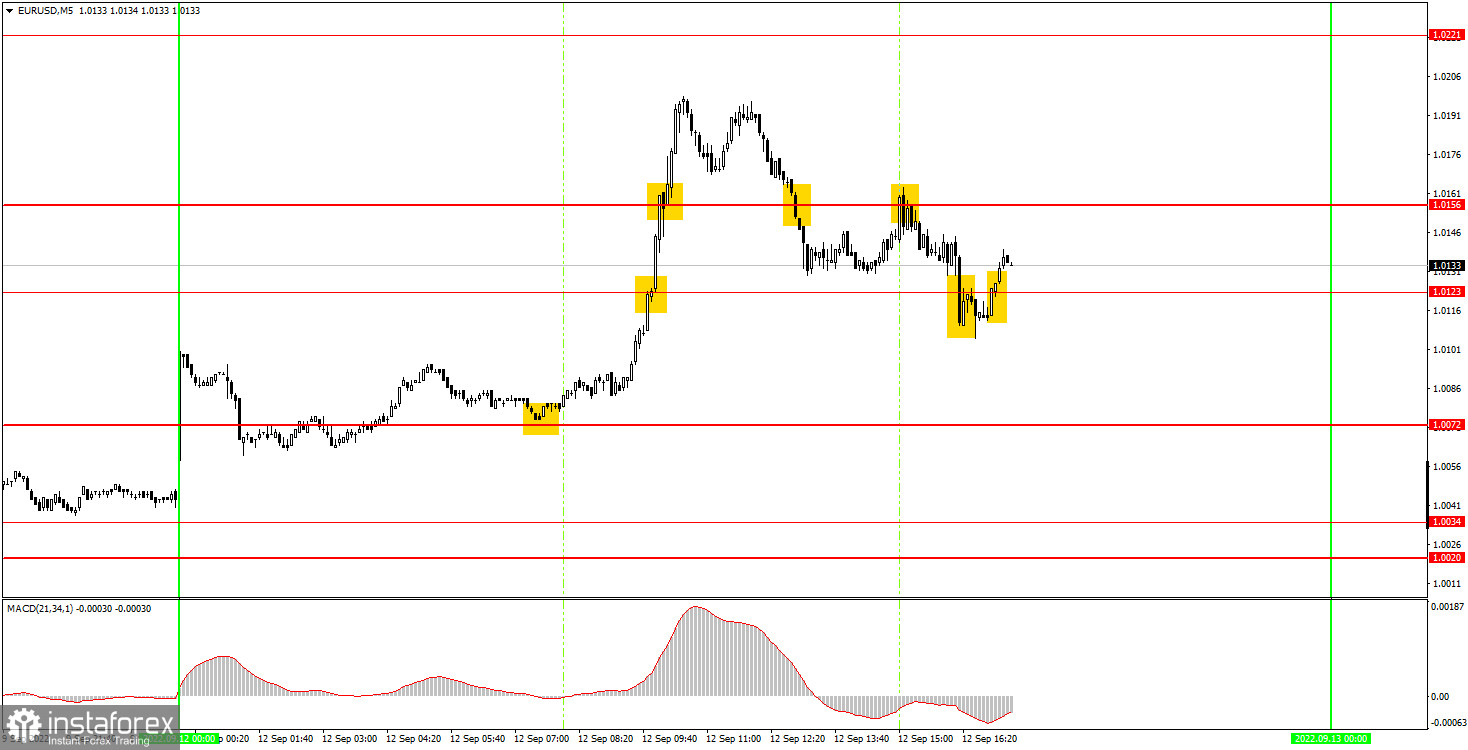
It is clearly seen on the 5-minute timeframe that the pair made a strong upward spurt at the opening of the day. And then - at the European trading session. But the euro also began to fall at the same European session and at the moment it has lost about half of what it gained at the beginning of the day. Such movements cannot be described as good for traders, but they could also make money. The main thing is that there were movements. The first buy signal was formed near the level of 1.0072 15 minutes before the opening of the European session. It could be worked out. The long position should have been closed only when the price fell back below the 1.0156 level. Profit on this transaction amounted to 65 points. There were two sell signals near the level of 1.0156. The pair initially fell below the level of 1.0123, but could not continue the fall after that and returned above this level. At this point, short positions should have been closed. Profit was another 15 points. The last signal to buy should no longer be worked out, since it was formed quite late in time. But even without it, beginners managed to make good money according to our recommendations.
How to trade on Tuesday:
The pair maintains an upward trend on the 30-minute timeframe. Therefore, the upward movement may continue for several more days, but be careful: this week there will be a lot of important macroeconomic reports. The euro moved away from its 20-year lows not so far to consider the downward trend unequivocally completed. On the 5-minute TF on Tuesday it is recommended to trade at the levels 1.0020-1.0034, 1.0072, 1.0123, 1.0156, 1.0221, 1.0269-1.0277. When passing 15 points in the right direction, you should set Stop Loss to breakeven. No important or simply interesting events planned in the European Union on Tuesday, but the most important inflation report for August will be published in the US. Based on this report, the Federal Reserve's rate decision could be made next week, so the market reaction could be very strong.
Basic rules of the trading system:
1) The signal strength is calculated by the time it took to form the signal (bounce or overcome the level). The less time it took, the stronger the signal.
2) If two or more deals were opened near a certain level based on false signals (which did not trigger Take Profit or the nearest target level), then all subsequent signals from this level should be ignored.
3) In a flat, any pair can form a lot of false signals or not form them at all. But in any case, at the first signs of a flat, it is better to stop trading.
4) Trade deals are opened in the time period between the beginning of the European session and until the middle of the US one, when all deals must be closed manually.
5) On the 30-minute TF, using signals from the MACD indicator, you can trade only if there is good volatility and a trend, which is confirmed by a trend line or a trend channel.
6) If two levels are located too close to each other (from 5 to 15 points), then they should be considered as an area of support or resistance.
On the chart:
Support and Resistance Levels are the Levels that serve as targets when buying or selling the pair. You can place Take Profit near these levels.
Red lines are the channels or trend lines that display the current trend and show in which direction it is better to trade now.
The MACD indicator (14,22,3) consists of a histogram and a signal line. When they cross, this is a signal to enter the market. It is recommended to use this indicator in combination with trend lines (channels and trend lines).
Important speeches and reports (always contained in the news calendar) can greatly influence the movement of a currency pair. Therefore, during their exit, it is recommended to trade as carefully as possible or exit the market in order to avoid a sharp price reversal against the previous movement.
Beginners on Forex should remember that not every single trade has to be profitable. The development of a clear strategy and money management are the key to success in trading over a long period of time.


