


Analysis of Monday's deals:
30M chart of the GBP/USD pair
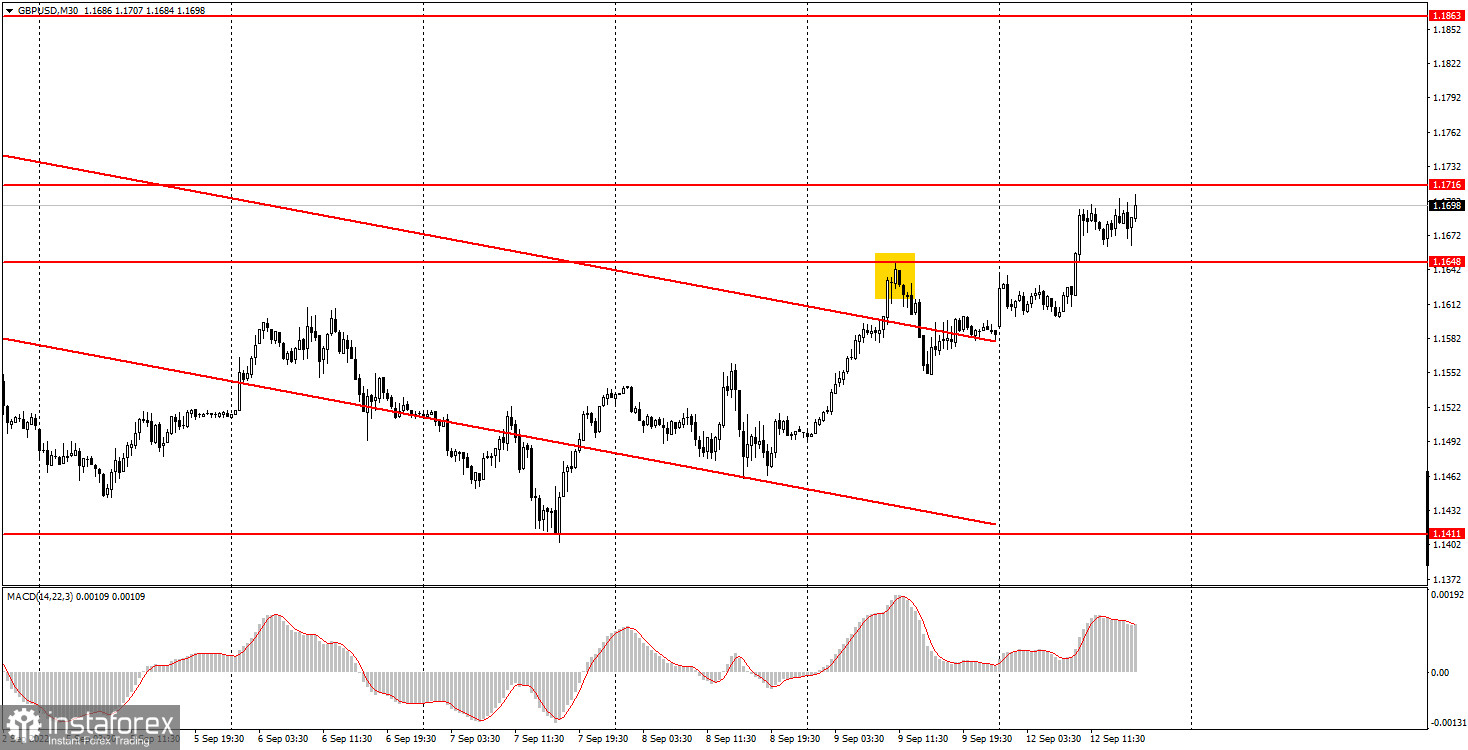
The GBP/USD pair continued its upward movement on Monday after leaving the downward channel. It overcame the 1.1648 level and, in general, the pound's movement was very similar to the euro's movement. At least in the morning. The euro still began to fall in price in the afternoon, but the pound did not. Given the fact that several important reports were just published in the UK, it was necessary to start from the British pound. However, these reports were rather ambiguous. First, take note that the pound's growth began half an hour after their release. Why did the market wait half an hour? Second, the reports themselves were not unambiguously positive. For example, GDP in July grew exactly as much as forecasted, while industrial production turned out to be much weaker than forecasts. Therefore, there were no grounds for buying the pound from the market. Nevertheless, the pound rose, and at the same time, the euro also rose. Why? We believe that the reason lies not in macroeconomic statistics, but in technique. Simply put, both the pound and the euro fell too long and strongly, sooner or later an upward correction was to begin. We said earlier that it is very difficult to predict the beginning of such a correction, and it can begin quite unexpectedly. Basically, that's what happened.
5M chart of the GBP/USD pair
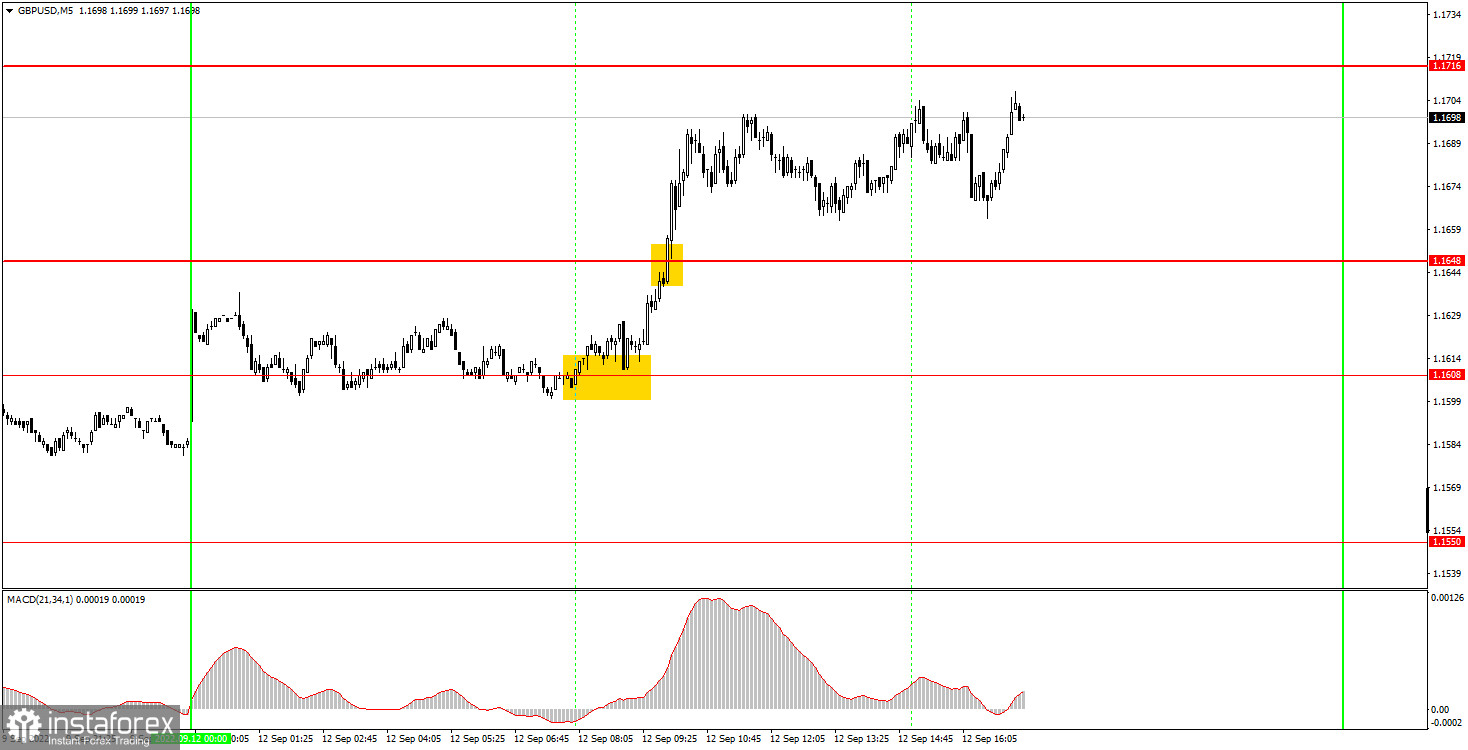
On the 5-minute timeframe, the trading picture was better than on the euro. Only two trading signals were formed for the entire day. First, the pair rebounded from the level of 1.1608, where it was necessary to open long positions, and a little later it overcame the level of 1.1648, where long positions should have been kept open. Further, for the rest of the day, the pair could neither reach the nearest target level of 1.1716, nor consolidate below 1.1648, which could be interpreted as a sell signal. Therefore, the deal had to be closed manually in the late afternoon. Considering that the volatility was quite high today, we managed to make good money – about 70-80 points. The pound has been growing for four consecutive days, but, as in the case of the euro, this could be a simple technical correction, after which the downward trend will resume.
How to trade on Tuesday:
The pound/dollar pair has consolidated above the descending channel on the 30-minute TF, so formally we now have an upward trend. Since there are enough levels at the current price values, you can trade the pair without any problems. An ascending trend line can be formed in the near future. There are a lot of macroeconomic statistics this week, so the movements can be strong with frequent reversals. On the 5-minute TF on Tuesday it is recommended to trade at the levels of 1.1550, 1.1608, 1.1648, 1.1716, 1.1755, 1.1793, 1.1863. When the price passes after opening a deal in the right direction for 20 points, Stop Loss should be set to breakeven. On Tuesday, the UK is scheduled to publish reports on unemployment, wages and applications for unemployment benefits. We do not consider these reports important, but a reaction of 20-30 points may follow. More important will be the speech of Bank of England Governor Andrew Bailey. And the inflation report for August in America. The last two events can set the tone for trading on Tuesday.
Basic rules of the trading system:
1) The signal strength is calculated by the time it took to form the signal (bounce or overcome the level). The less time it took, the stronger the signal.
2) If two or more deals were opened near a certain level based on false signals (which did not trigger Take Profit or the nearest target level), then all subsequent signals from this level should be ignored.
3) In a flat, any pair can form a lot of false signals or not form them at all. But in any case, at the first signs of a flat, it is better to stop trading.
4) Trade deals are opened in the time period between the beginning of the European session and until the middle of the US one, when all deals must be closed manually.
5) On the 30-minute TF, using signals from the MACD indicator, you can trade only if there is good volatility and a trend, which is confirmed by a trend line or a trend channel.
6) If two levels are located too close to each other (from 5 to 15 points), then they should be considered as an area of support or resistance.
On the chart:
Support and Resistance Levels are the Levels that serve as targets when buying or selling the pair. You can place Take Profit near these levels.
Red lines are the channels or trend lines that display the current trend and show in which direction it is better to trade now.
The MACD indicator (14,22,3) consists of a histogram and a signal line. When they cross, this is a signal to enter the market. It is recommended to use this indicator in combination with trend lines (channels and trend lines).
Important speeches and reports (always contained in the news calendar) can greatly influence the movement of a currency pair. Therefore, during their exit, it is recommended to trade as carefully as possible or exit the market in order to avoid a sharp price reversal against the previous movement.
Beginners on Forex should remember that not every single trade has to be profitable. The development of a clear strategy and money management are the key to success in trading over a long period of time.


