


Analysis of Tuesday's deals:
30M chart of the EUR/USD pair
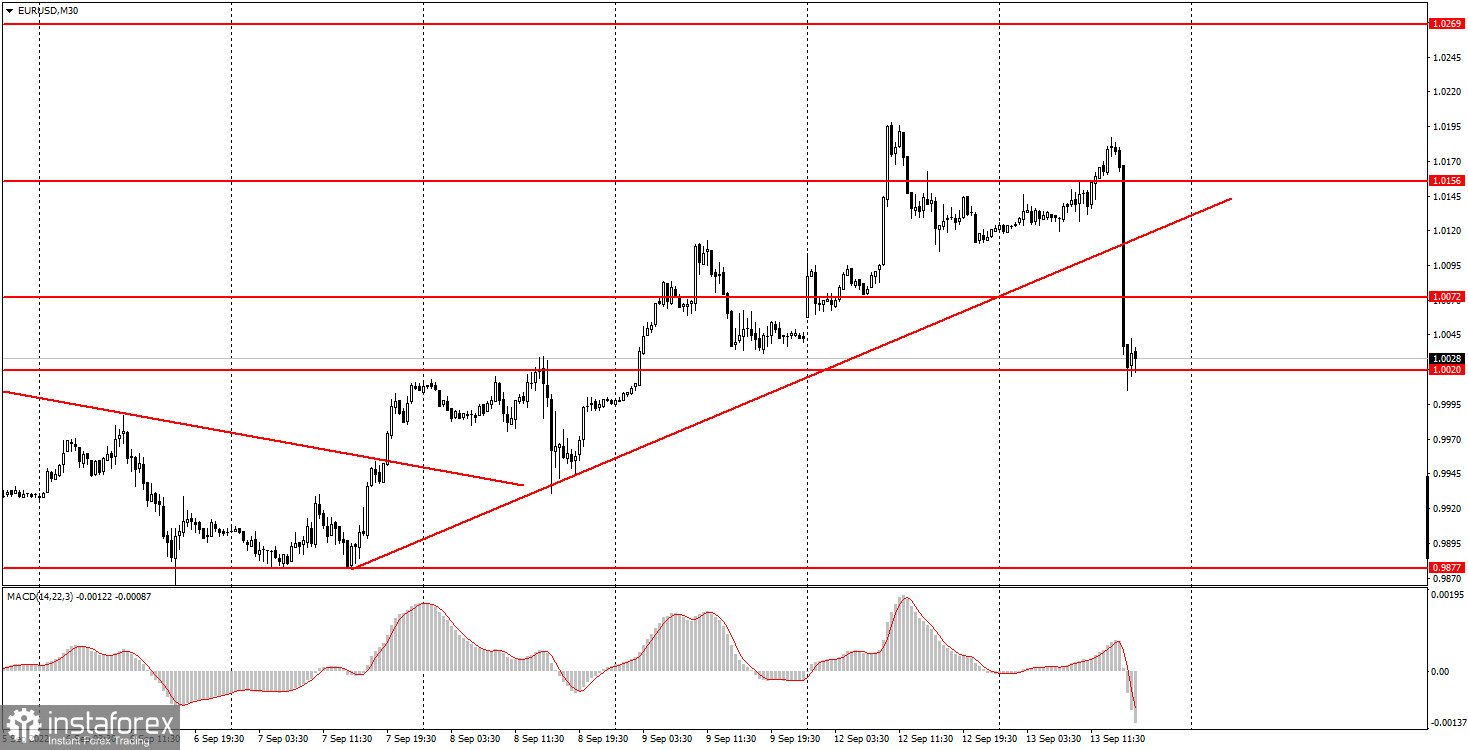
The EUR/USD currency pair fell on Tuesday. This happened after the market saw a new report on US inflation, as the Federal Reserve's decision next week will largely depend on this data. The consumer price index fell to 8.3% in August. It seems that everything is fine, inflation continues to decline! However, the market expected to see a more significant drop in the indicator, and not 0.2%. The fact that traders' expectations were not justified has caused the dollar to sharply rise. And why, in fact, did the US dollar rise? Because, now the market is 99% certain that the Fed will raise the rate for the third consecutive time by 0.75% next week, that is, it will implement the most hawkish scenario. Recently, the market openly hoped that inflation would now show a significant slowdown every month, but, as practice has shown, it did not. And the higher inflation remains, the higher the Fed will raise the rate, which is great for the US currency. Thus, the euro fell again, failing to even properly correct, the price settled below the ascending trend line, which was canceled very quickly, and now the price can once again head for its 20-year lows.
5M chart of the EUR/USD pair
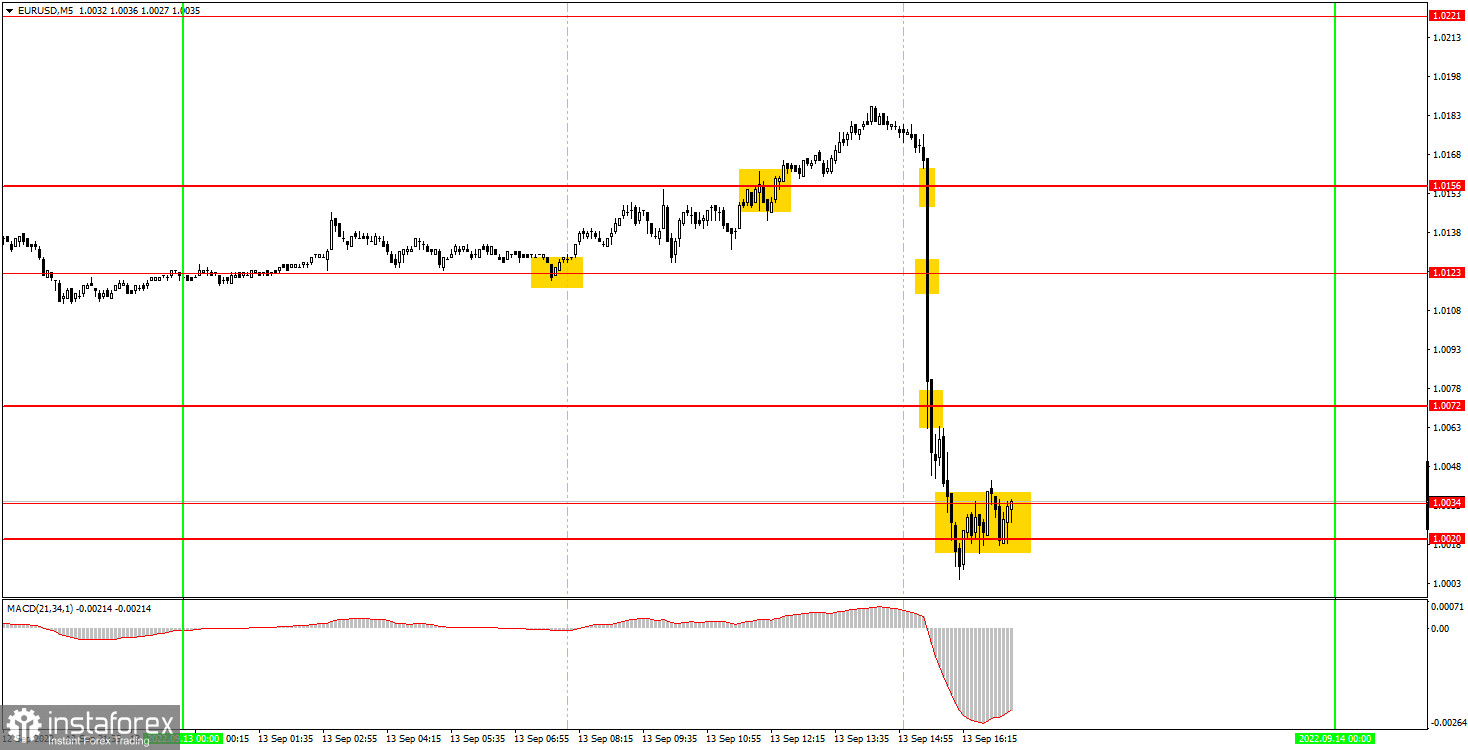
You can clearly see on the 5-minute timeframe that the main movement of the day by 170 points to the downside occurred in the next half hour after the release of the US inflation report. It is unlikely that any of the novice traders managed to enter the market on this movement. It is unlikely that you should have entered the market five minutes before the release, during or five minutes after. The inflation report is a very strong and important report, which is why we saw the market's reaction to it had reached 170 points. Thus, beginners could only work out the first and second buy signals, which formed around the levels of 1.0123 and 1.0156. Only one trade was to be opened, and it had to be closed manually at least half an hour before the "report of the day" was released. Traders managed to earn about 40 points on it, so they still did not leave the market without profit for the day. The last signal near the area of 1.0020-1.0034 should no longer be worked out, since the pair had already calmed down by that time and it became difficult to count on a strong movement.
How to trade on Wednesday:
The pair easily and simply, with the help of just one report, canceled the upward trend on the 30-minute timeframe and now can rush down again to update its 20-year lows. If the level of 1.0020 is overcome, then the chances of a further fall in quotes will increase even more. On the 5-minute TF on Wednesday it is recommended to trade at the levels of 0.9910, 0.9952, 1.0020-1.0034, 1.0072, 1.0123, 1.0156, 1.0221. When passing 15 points in the right direction, you should set Stop Loss to breakeven. The market will be somewhat calm on Wednesday. At least in terms of macroeconomic and fundamental background. A report on industrial production in the US will be released on Wednesday, which is objectively not significant. However, traders can continue to work out the US inflation report in the European trading session.
Basic rules of the trading system:
1) The signal strength is calculated by the time it took to form the signal (bounce or overcome the level). The less time it took, the stronger the signal.
2) If two or more deals were opened near a certain level based on false signals (which did not trigger Take Profit or the nearest target level), then all subsequent signals from this level should be ignored.
3) In a flat, any pair can form a lot of false signals or not form them at all. But in any case, at the first signs of a flat, it is better to stop trading.
4) Trade deals are opened in the time period between the beginning of the European session and until the middle of the US one, when all deals must be closed manually.
5) On the 30-minute TF, using signals from the MACD indicator, you can trade only if there is good volatility and a trend, which is confirmed by a trend line or a trend channel.
6) If two levels are located too close to each other (from 5 to 15 points), then they should be considered as an area of support or resistance.
On the chart:
Support and Resistance Levels are the Levels that serve as targets when buying or selling the pair. You can place Take Profit near these levels.
Red lines are the channels or trend lines that display the current trend and show in which direction it is better to trade now.
The MACD indicator (14,22,3) consists of a histogram and a signal line. When they cross, this is a signal to enter the market. It is recommended to use this indicator in combination with trend lines (channels and trend lines).
Important speeches and reports (always contained in the news calendar) can greatly influence the movement of a currency pair. Therefore, during their exit, it is recommended to trade as carefully as possible or exit the market in order to avoid a sharp price reversal against the previous movement.
Beginners on Forex should remember that not every single trade has to be profitable. The development of a clear strategy and money management are the key to success in trading over a long period of time.


