


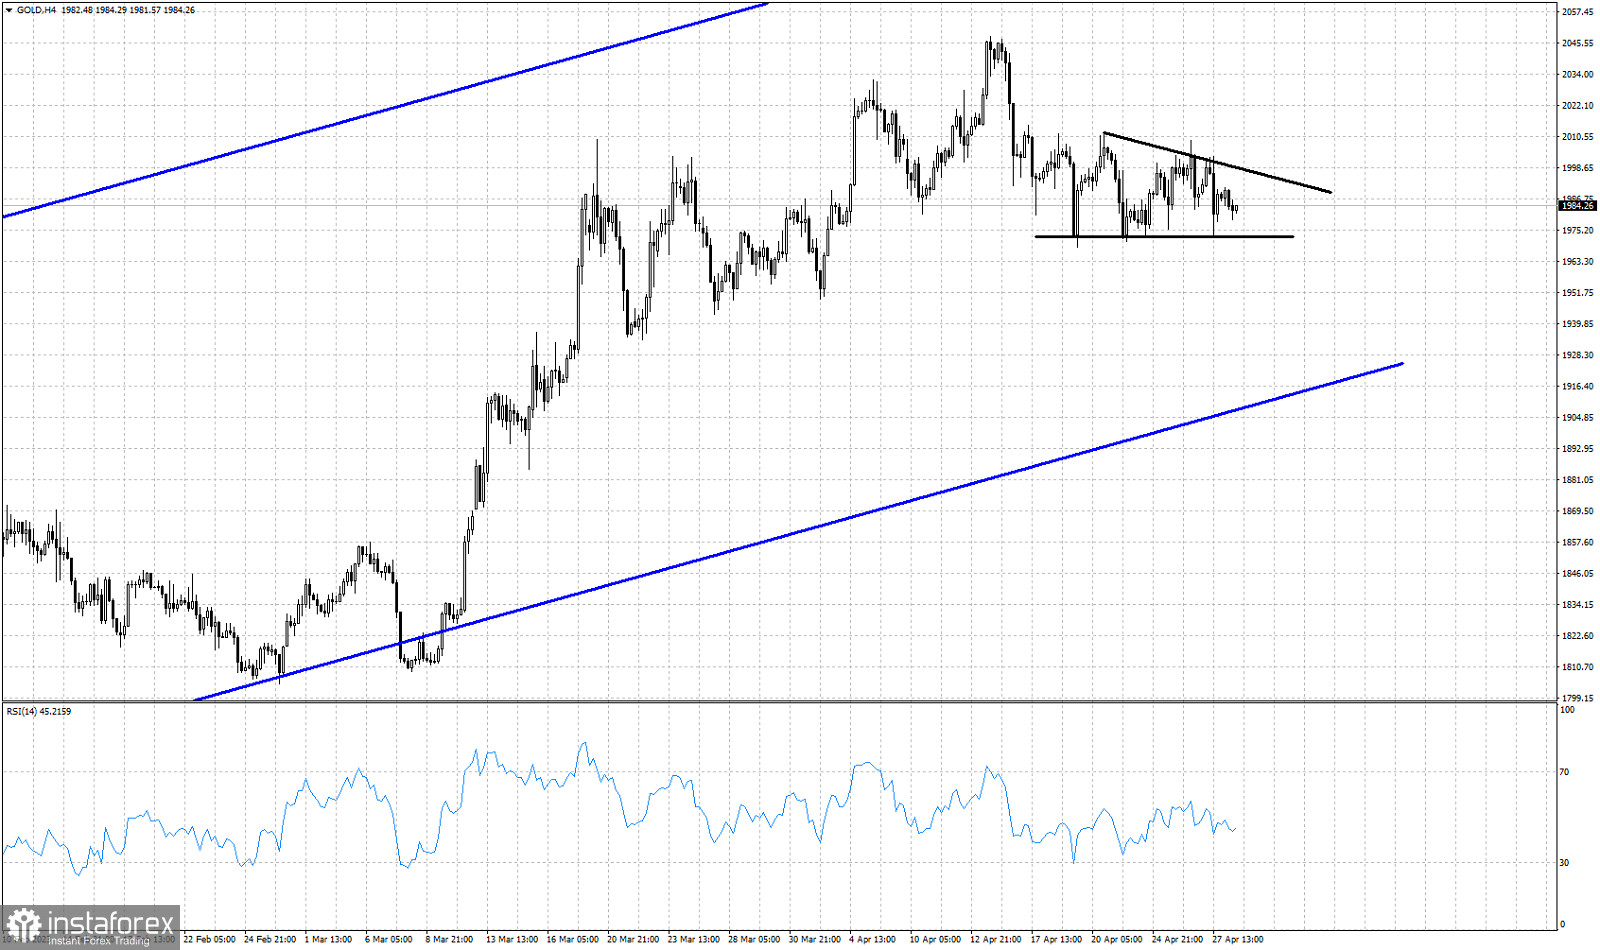
Blue lines- bullish channel
Black lines- descending triangle pattern
Gold price is trading around $1,980. Price has formed a descending triangle pattern. Price is making lower highs while price continues to respect the recent low of $1,968, Price is mostly moving sideways over the last few days as it remains inside the medium-term upward sloping blue channel. As we mentioned in previous posts, Gold price remains vulnerable to a move lower towards $1,920 and the lower channel boundary. A break below the base of the triangle pattern will activate the bearish signal for a move lower. Resistance is at $1,999 and bulls will need to break above this level in order to avoid the danger of a deeper pull back.


