Gold:

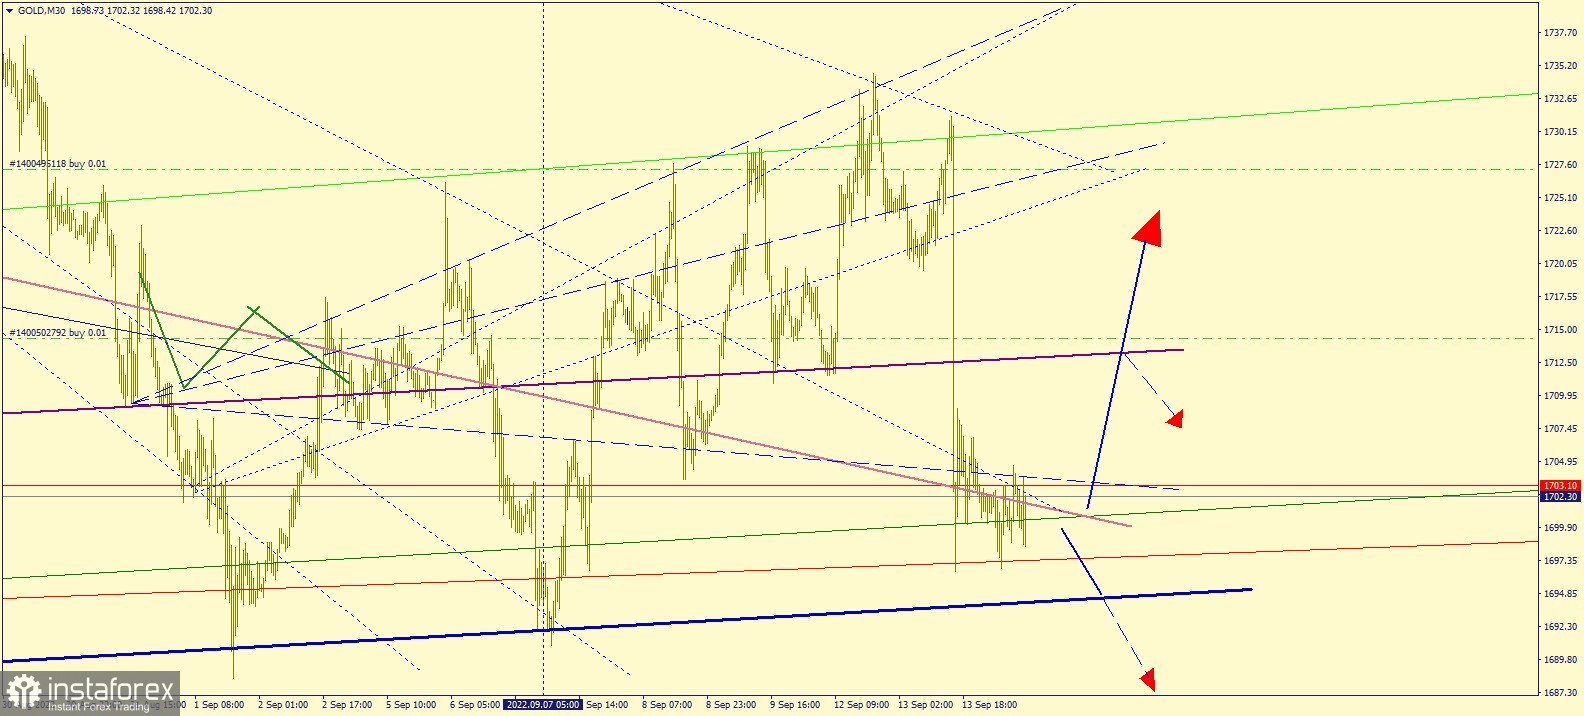
The chart shows the movement of gold in the 30-minute chart.
The previous analysis suggested further price growth in the medium term. However, the market is clearly volatile, as indicated by the nodes in the area of $1700.00 - $1704.00.
Considering that the key support level is the sloping line (blue) at $1694.00, there are two possible developments in gold.
First is a rise towards the resistance level of $1713.00 after the test of $1700. In case of a breakdown, quotes will head towards $1728.00.
The second is the breakdown of the key support level of $1694.00.
Good luck!


