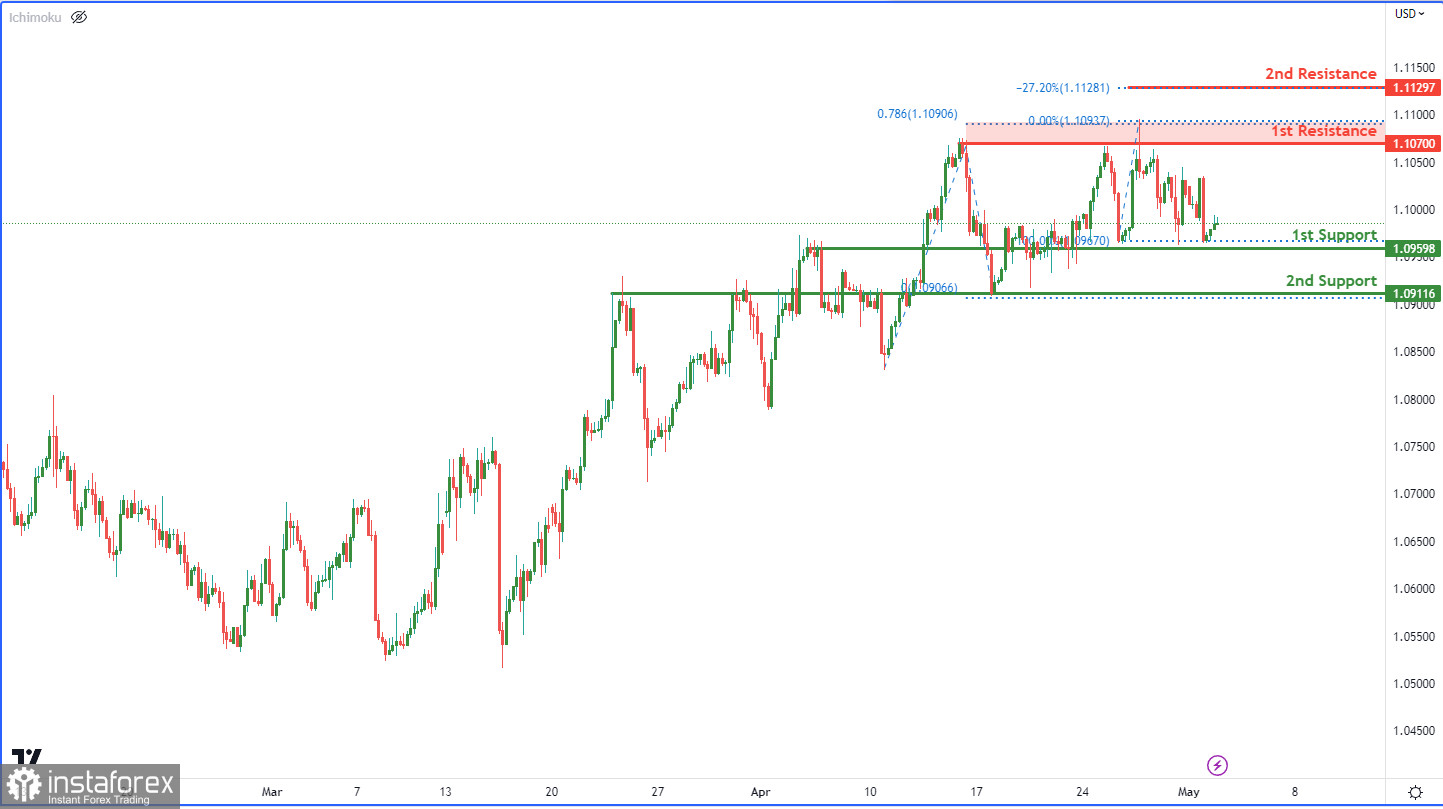
The EUR/USD chart is currently displaying strong bullish momentum, indicating a possible bullish continuation towards the 1st resistance level. An overlap support level at 1.0959 has been tested several times in the past and has proven to be a robust support level for the EUR/USD chart.
In the event of a price drop below the 1st support level, the 2nd support level at 1.0911, which is also an overlap support level, would be the next target. This level coincides with a previous swing low and has been a reliable support level for the EUR/USD chart.
Conversely, a multi-swing high resistance level at 1.1070, combined with a 78.60% Fibonacci projection, makes it a significant resistance level that has held up several times in the past. If the price breaks above the 1st resistance level, the next target would be the 2nd resistance level at 1.1129. This level is a swing high resistance level that also coincides with a -27% Fibonacci expansion, adding to its strength as a resistance level for the EUR/USD chart.


