To open long positions on EURUSD, you need:
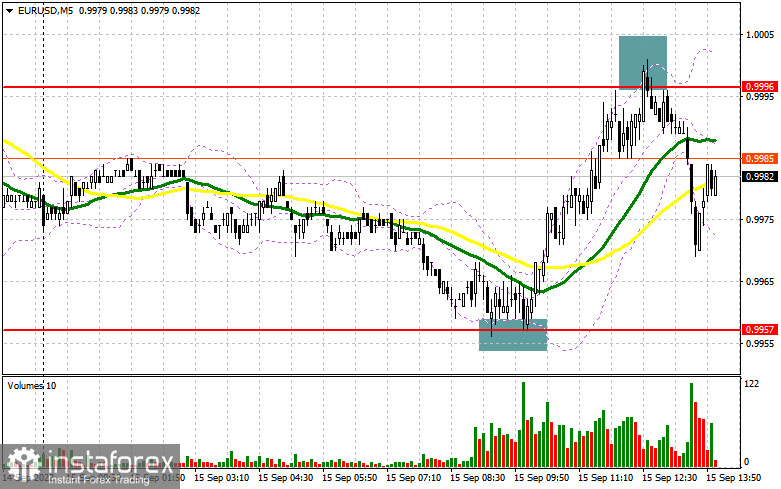
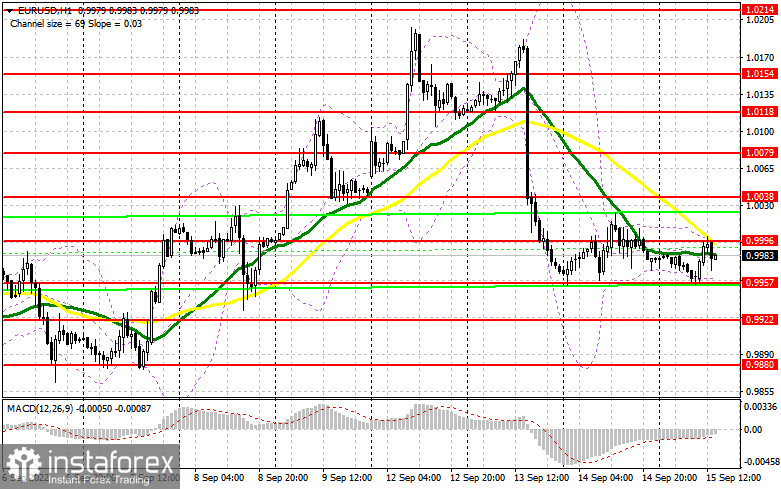
In the afternoon, quite important statistics on the United States are released, which should rock the market. The entire focus will be on the change in the volume of retail trade in the United States for August of this year. If the indicator turns out to be better than economists' forecasts, the EUR/USD pair will fall to the next weekly highs, as this will preserve concerns about the growth of inflationary pressure in the country. Reports on the number of initial applications for unemployment benefits, the Fed-Philadelphia manufacturing index, and the Empire Manufacturing index will be of secondary importance. In the case of a decline in the euro to the area of 0.9957, the optimal scenario for buying will be only a false breakdown by analogy with what I discussed above. This will give an entry point based on a repeated upward correction with the immediate goal of restoring to the level of 0.9996, which could not be reached above in the first half of the day. In the case of weak retail sales data in the US, a breakout and a top-down test of 0.9996 will hit the bears' stop orders, forming an additional signal to open long positions with the possibility of correction to the area of 1.0038. A distant target will be the resistance of 1.0079, where I recommend fixing the profits. If EUR/USD declines and there are no buyers at 0.9957, the pressure on the pair will increase, opening the way to September lows. In this case, the optimal solution for opening long positions will be a false breakdown near the minimum of 0.9922. I advise buying EUR/USD immediately for a rebound only from 0.9880, or even lower – around 0.9849 with an upward correction of 30-35 points within a day.
To open short positions on EURUSD, you need:
The bears acted quite pragmatically and did not force events in the first half of the day, although, by analogy with yesterday, they attempted to break 0.9957. The main task for today remains to protect the nearest resistance of 0.9996, from which we have already fallen once. While trading will be conducted below this range, we can count on a further fall of the pair. Of course, the optimal scenario would be a false breakout at 0.9996 and strong statistics on the US, which would collapse the euro to 0.9957. A breakdown and consolidation below this range with a reverse test from the bottom up already forms an additional sell signal with the demolition of buyers' stop orders and a larger drop in the pair to the 0.9922 area. I recommend fixing profits there. A further target will be a minimum of 0.9880, but this is in case the bulls lose all interest in the euro after the retail sales data. In case of an upward jump of EUR/USD during the US session and the absence of bears at 0.9996, an upward correction will lead to the next resistance of 1.0038. In this scenario, I recommend opening short positions from 1.0038 only if a false breakdown is formed. You can sell EUR/USD immediately on a rebound from the maximum of 1.0079, or even higher – from 1.0118 with the aim of a downward correction of 30-35 points.


Signals of indicators:
Moving Averages
Trading is conducted below the 30 and 50-day moving averages, which indicates that the pressure on the pair remains.
Note: The author considers the period and prices of moving averages on the hourly chart H1 and differ from the general definition of the classic daily moving averages on the daily chart D1.
Bollinger Bands
In case of a decline, the lower limit of the indicator, around 0.9957, will act as support.
Description of indicators
- Moving average (moving average determines the current trend by smoothing out volatility and noise). Period 50. The graph is marked in yellow.
- Moving average (moving average determines the current trend by smoothing out volatility and noise). Period 30. The graph is marked in green.
- MACD indicator (Moving Average Convergence / Divergence - moving average convergence/divergence) Fast EMA period 12. Slow EMA period 26. SMA period 9
- Bollinger Bands (Bollinger Bands). Period 20
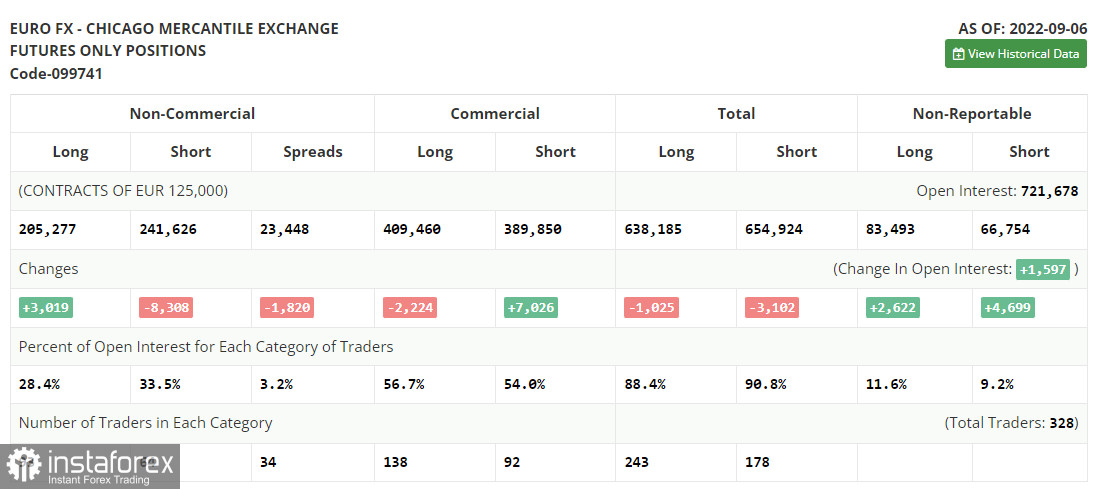
- Non-profit speculative traders, such as individual traders, hedge funds, and large institutions use the futures market for speculative purposes and to meet certain requirements.
- Long non-commercial positions represent the total long open position of non-commercial traders.
- Short non-commercial positions represent the total short open position of non-commercial traders.
- Total non-commercial net position is the difference between the short and long positions of non-commercial traders.


