


Trend analysis (Fig. 1).
The euro-dollar pair may move downward from the level of 0.9997 (close of yesterday's daily candle) to the lower fractal 0.9955 (daily candle from 09/15/2022). Upon reaching this level, an upward movement is possible with the target of 0.9982, the 23.6% retracement level (white dotted line). When testing this level, the price may continue to move upwards with the target of 1.0056 (white dotted line).
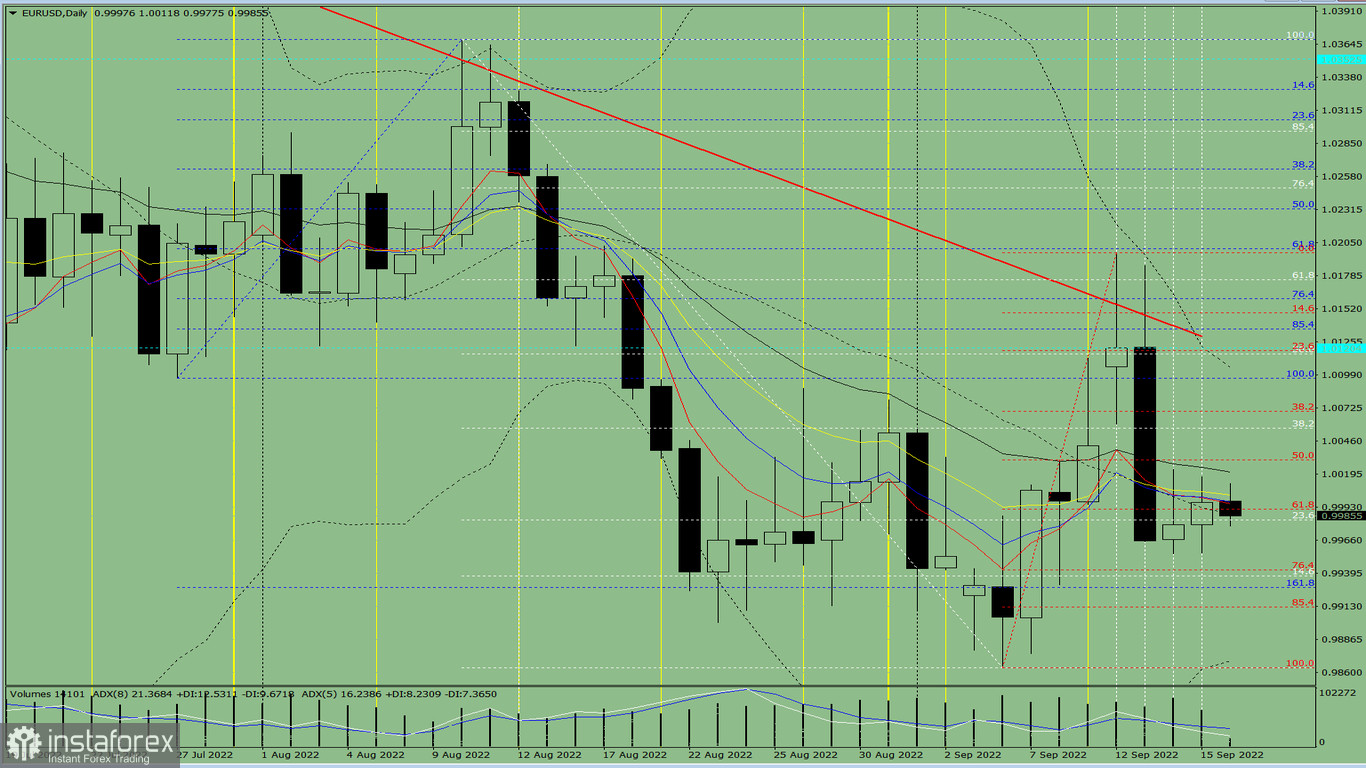
Fig. 1 (daily chart).
Comprehensive analysis:
- Indicator analysis – down;
- Fibonacci levels – down;
- Volumes – down;
- Candlestick analysis – down;
- Trend analysis – down;
- Bollinger bands – down;
- Weekly chart – down.
General conclusion:
Today, the price may move downward from the level of 0.9997 (close of yesterday's daily candle) to the lower fractal 0.9955 (daily candle from 09/15/2022). Upon reaching this level, an upward movement is possible with the target of 0.9982, the 23.6% retracement level (white dotted line). When testing this level, the price may continue to move upwards with the target of 1.0056 (white dotted line).
Alternative scenario: from 0.9997 (close of yesterday's daily candle), the price may move downward to 0.9928, the 161.8% Fibonacci retracement level (blue dotted line). Upon reaching this level, an upward movement is possible to test 0.9982, the 23.6% retracement level (white dotted line). After testing this level, the price may continue to move upwards with the target of 1.0056, the 38.2% retracement level (white dotted line).


