


Details of the economic calendar for September 15
US retail sales declined from 10.1% to 9.1% YoY, which was already expected and has been taken into account by the market. Meanwhile, the volume of industrial production slowed down from 3.8% to 3.7% YoY, with a forecast of a stronger fall, to 3.5%.
Weekly data on jobless claims were also released, where forecasts did not coincide with the actual data, which saw a decline.
Statistics details:
The volume of continuing claims for benefits rose from 1.401 million to 1.403 million, while the previous data was revised in favor of a decrease from 1.473 million to 1.401 million.
The volume of initial claims for benefits fell from 232,000 to 224,000.
Interesting moments
ECB Vice President Luis De Guindos made a comment, emphasizing that the regulator will not stop its strategy of tightening monetary policy.
Key points of the speech:
- The EU faces challenging prospects;
- Inflation is extremely high, and price pressure continues to intensify and expand;
- We are in a period of uncertainty regarding future prospects;
- Euro devaluation increases inflationary pressure;
- Economic growth will certainly slow down;
- Monetary policy needs to walk a fine line to remedy the situation.
Analysis of trading charts from September 15
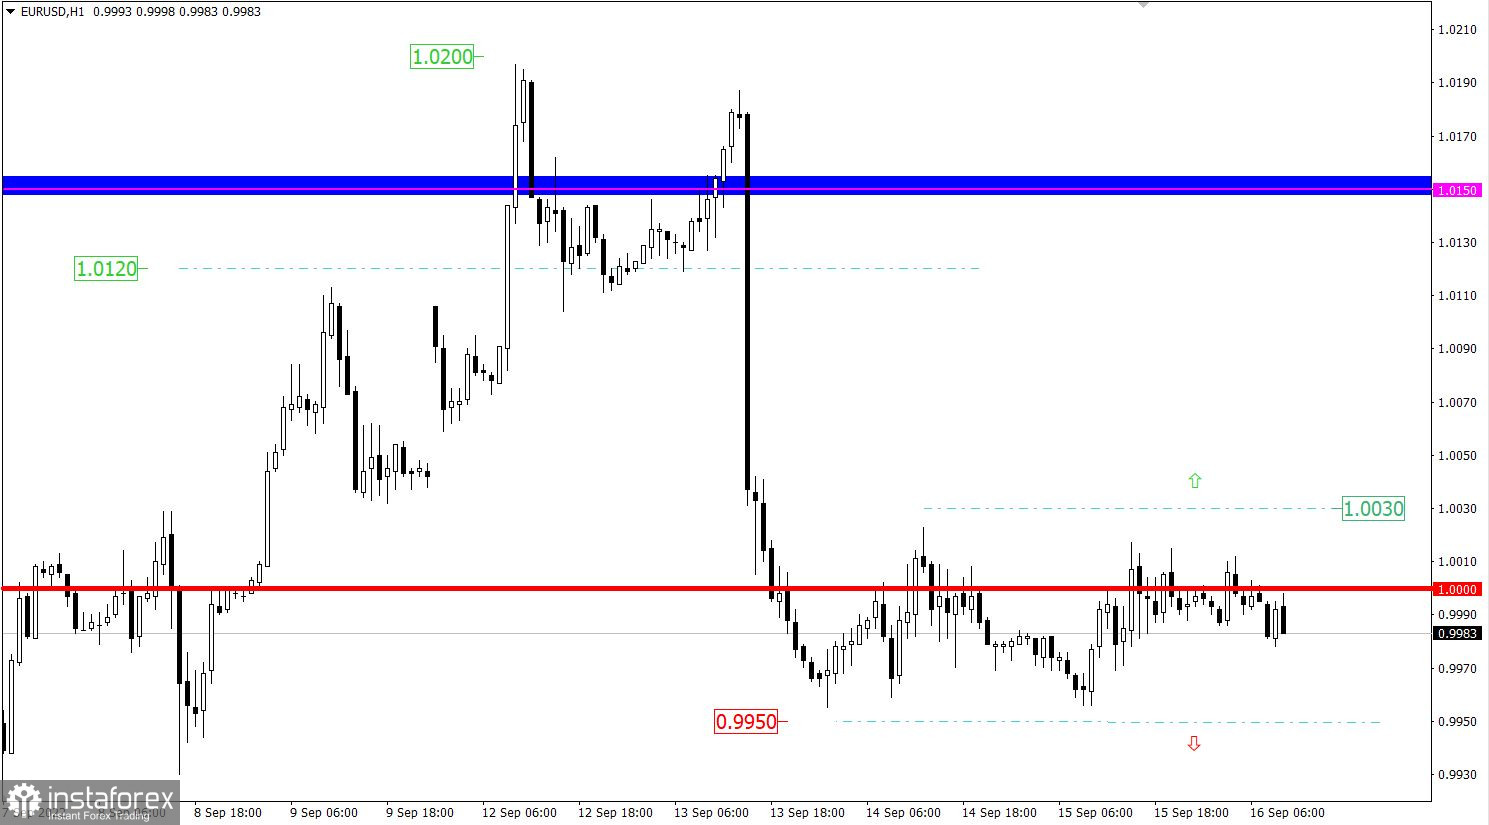
The EURUSD currency pair has been moving along the parity level for the second day in a row, which led to the formation of a short-term side channel on the market within the boundaries of 0.9955/1.0020.
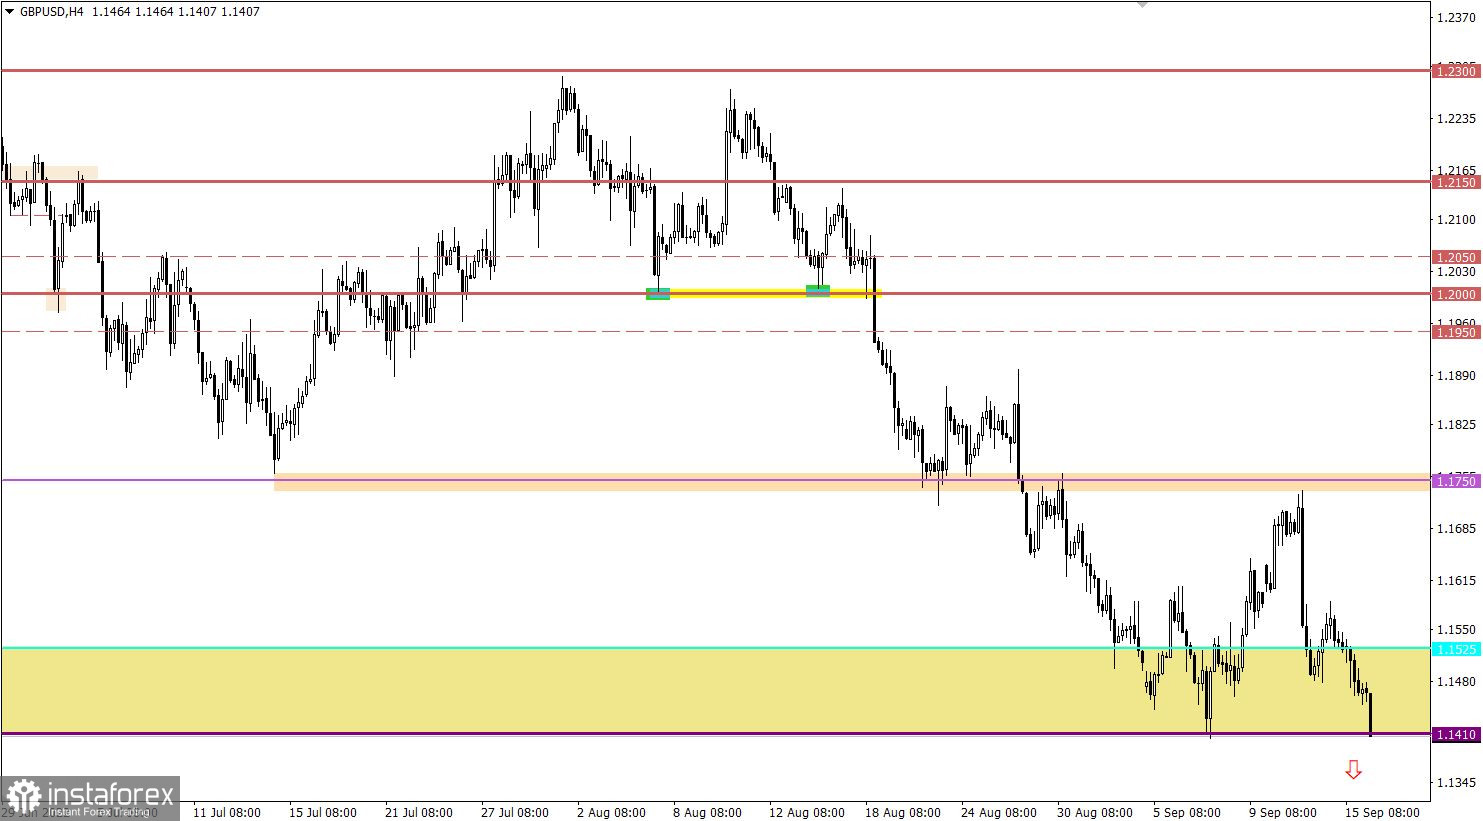
The GBP/USD currency pair is steadily declining, despite the growing oversold level. The quote has already overcome the local low of 2020, which indicates a high desire of sellers to keep the given cycle.

Economic calendar for September 16
At the opening of European session, data on UK retail sales were published, which has accelerated its decline from -3.2% to -5.4%. Negative data instantly played on the value of the British currency in terms of its weakening.
Euro area inflation data is also scheduled for publication today, which may rise from 8.9% to 9.1%. In fact, rising inflation will once again indicate that the ECB may raise the refinancing rate by 75 basis points at least one more time.
In this case, this news may support the European currency.
Time targeting:
EU Inflation – 09:00 UTC
Trading plan for EUR/USD on September 16
In this situation, there is a process of accumulation of trading forces, which will eventually lead to an outgoing price impulse. The best trading tactic is the method of breaking through one or another border 0.9955/1.0020.
We concretize the above:
The downward move will be relevant after the price holds below 0.9950. This step may lead to an update of the low of the downward trend.
An upward movement in the currency pair is taken into account in case of a stable holding of the price above the value of 1.0030 in a four-hour period.
Trading plan for GBP/USD on September 16
At the moment, the quote is moving at the levels of 1985, where speculators ignore all technical signals about overheating of short positions in the pound. The inertial move will end sooner or later, which will lead to a technical pullback on the market. Until then, a decline is still possible.
What is shown in the trading charts?
A candlestick chart view is graphical rectangles of white and black light, with sticks on top and bottom. When analyzing each candle in detail, you will see its characteristics of a relative period: the opening price, closing price, and maximum and minimum prices.
Horizontal levels are price coordinates, relative to which a stop or a price reversal may occur. These levels are called support and resistance in the market.
Circles and rectangles are highlighted examples where the price of the story unfolded. This color selection indicates horizontal lines that may put pressure on the quote in the future.
The up/down arrows are the reference points of the possible price direction in the future.


