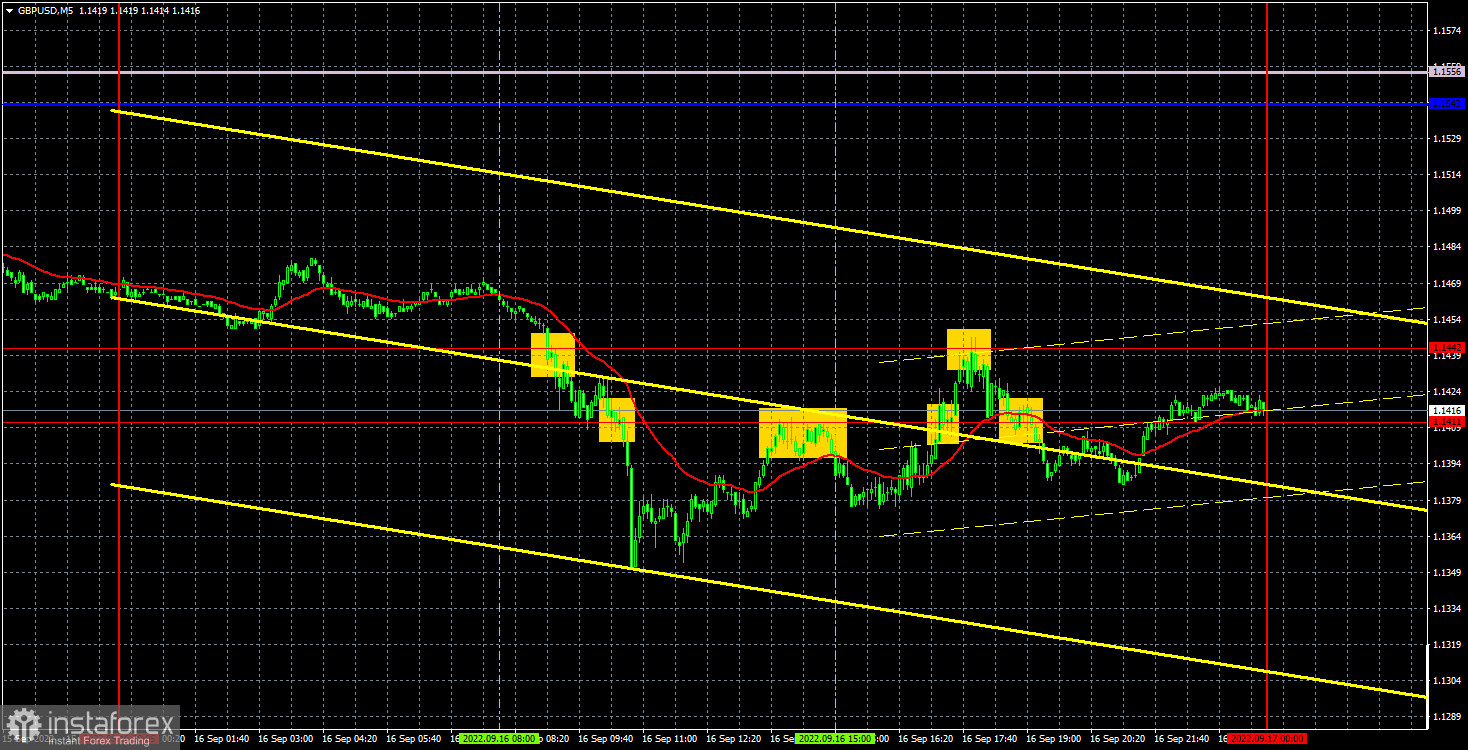
Analysis of the GBP/USD 5M.

The GBP/USD currency pair moved badly on Friday. First, there was an almost landslide drop of another 100 points, which was hardly provoked by the report on retail sales in the UK and a new, regular update of 37-year lows. Then a complex correction. The retail sales report, of course, was bad, but hardly so bad that the pound collapsed by 100 points in a couple of hours. However, the British pound now, in principle, does not need good reasons and grounds to continue its decline. Thus, we are not surprised that the British currency has collapsed again. However, there were no other levels below the level of 1.1411, so there was simply nothing to trade in this area. Nevertheless, in the area of 1.1411–1.1442, a sufficient number of signals were formed, but the nature of the movement did not allow much to be earned on them. We also note the consumer sentiment index from the University of Michigan, which was generally in line with forecasts. Therefore, there was practically no reaction to it.
Let's go back to trading signals. The first signal was formed when the level of 1.1442 was overcome. After that, the price went down 75 points, but it was possible to make a profit on this transaction only when it was manually closed. In principle, there were no other options for making a profit since there was no other level below the level of 1.1411. However, there was enough time to close the deal with a profit of 50 points. The next sell signal was formed with a rebound from 1.1411, but then the price went down only 22 points, so the deal closed at a stop loss at breakeven. The next signal is to buy – overcoming the level of 1.1411, and a further rebound from 1.1442 did not allow you to earn anything. The last two signals should have been ignored since they were formed quite late.
COT Report:
The latest COT report on the British pound, released yesterday, was very eloquent. During the week, the non-commercial group closed 5,700 buy contracts and opened 15,500 sell contracts. Thus, the net position of non-commercial traders immediately decreased by 21.1 thousand, which is a lot for the pound. The net position indicator has been growing for several months. However, the mood of major players remains "pronounced bearish," which is seen by the second indicator in the illustration above (purple bars below zero = "bearish" mood). And now, it has started a new fall, so the British pound still cannot count on strong growth. How can you count on it if the market sells the pound more than it buys it? And now, its decline has resumed altogether, so the "bearish" mood of the major players in the near future can only intensify. The non-commercial group has opened a total of 103 thousand contracts for sale and 52 thousand for purchase. The difference is twofold. Net positions will have to grow for a long time for these figures to at least level up. Moreover, COT reports reflect the moods of major players, and the "foundation" and geopolitics affect their moods. If they remain the same now, the pound may be at a "downward peak" for some time.
Analysis of GBP/USD 1H.
The pound/dollar pair has been in a downward movement on the hourly timeframe all last week. Although there is no trend line now, the downward trend is visible to the naked eye. We believe that the pair's 37-year lows will be updated more than once, given the weakness of the bulls and the lack of clear reasons for buying the pound. On September 19, we highlighted the following important levels: 1.1411-1.1442, 1.1649, 1.1760, 1.1874. Moreover, the Senkou Span B (1.1569) and Kijun-sen (1.1543) lines can also be signal sources. Signals can be "bounces" and "surmounts" of these levels and lines. It is recommended to set the stop loss level to break even when the price passes in the right direction by 20 points. The lines of the Ichimoku indicator can move during the day, which should be considered when determining trading signals. Also, in the illustration, support and resistance levels can be used to fix profits on transactions. There won't be a single interesting event on Monday in the UK or the US. However, recall that this week the meetings of the Bank of England and the Fed will be held, so volatility is unlikely to be low. Traders can expect strong, trending movements as early as Monday.
Explanations of the illustrations:
Price levels of support and resistance (resistance/support) are thick red lines near which the movement may end. They are not sources of trading signals.
The Kijun-sen and Senkou Span B lines are the lines of the Ichimoku indicator, transferred to the hourly timeframe from the 4-hour one. They are strong lines.
Extreme levels are thin red lines from which the price bounced earlier. They are sources of trading signals.
Yellow lines are trend lines, channels, and other technical patterns.
Indicator 1 on the COT charts is the net position size of each category of traders.
Indicator 2 on the COT charts is the net position size for the "Non-commercial" group.


