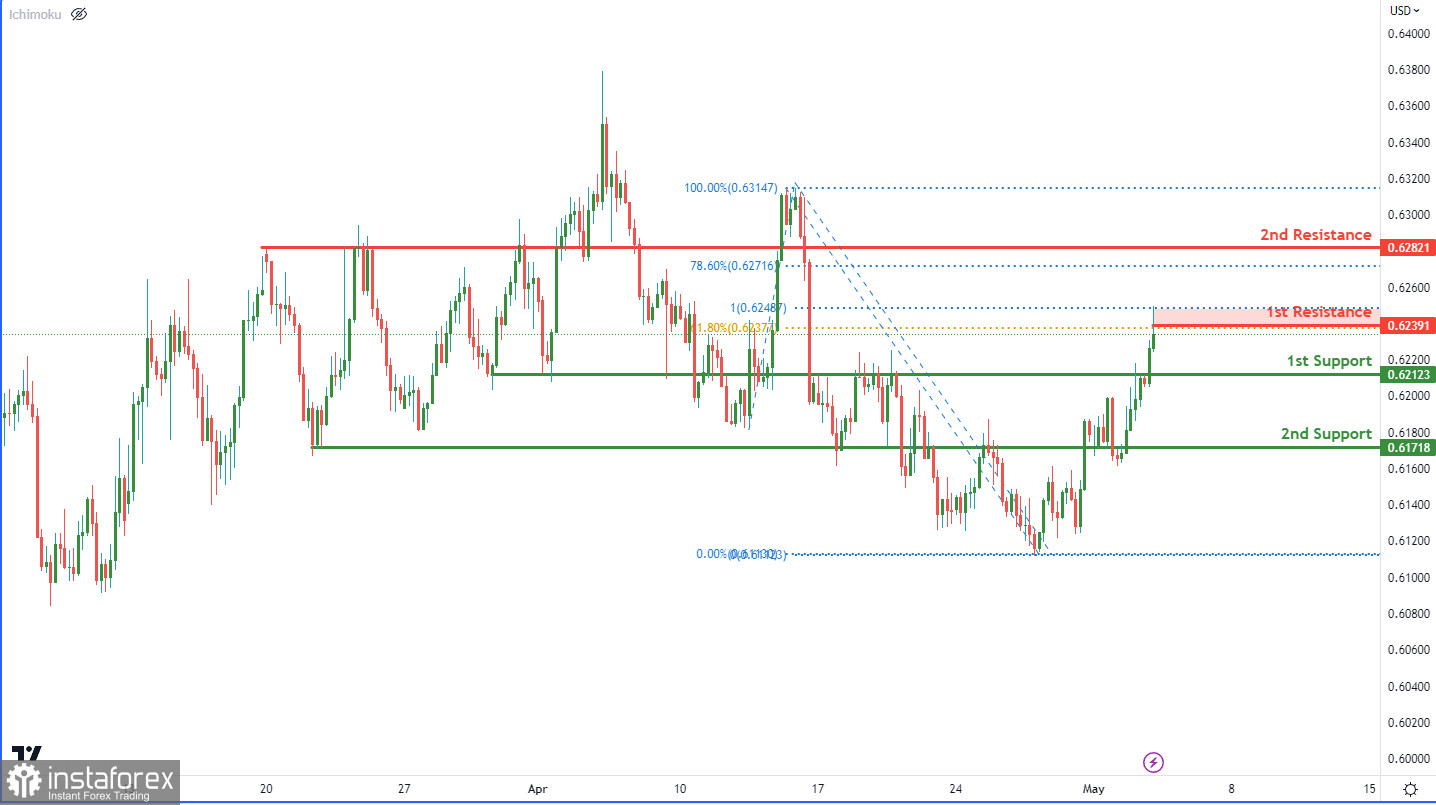
The NZD/USD chart is currently demonstrating a strong bearish momentum and is testing a key resistance level at 0.6239. This resistance level is significant as it lines up with the Fibonacci confluence of the 61.8% Fibonacci retracement and 100% Fibonacci projection. If the price reacts bearishly off this level, it could potentially drop towards the 1st support level at 0.6212, which is a pullback support level. Alternatively, if the price breaks through the 1st support level, it may continue its bearish movement towards the 2nd support level at 0.6171, which is also a pullback support level.
On the upside, if the price manages to break through the 1st resistance level at 0.6239, it may continue its bullish movement towards the 2nd resistance level at 0.6282, which is a pullback resistance level and coincides with the 78.60% Fibonacci retracement. However, given the overall bearish momentum of the chart, this scenario seems less likely.


