Details of the economic calendar for September 16
Retail sales fell 1.6% on a monthly basis in August, according to the UK Office for National Statistics (ONS). This is the most significant decline since December 2021. On an annualized basis, sales fell 5.4% after falling 3.2% in July.
The decline in retail sales is a negative factor, which is another sign that the economy is slipping into recession.
The pound sterling was actively losing value during the publication of statistical data.
In Europe, data on inflation accelerated from 8.9% to 9.1%. The final data coincided with the preliminary estimate.
Rising inflation indicates that the ECB will once again raise the refinancing rate by 75 basis points. The expectation of further growth of the rate has a positive effect on the euro during the publication of inflation data.
Analysis of trading charts from September 16
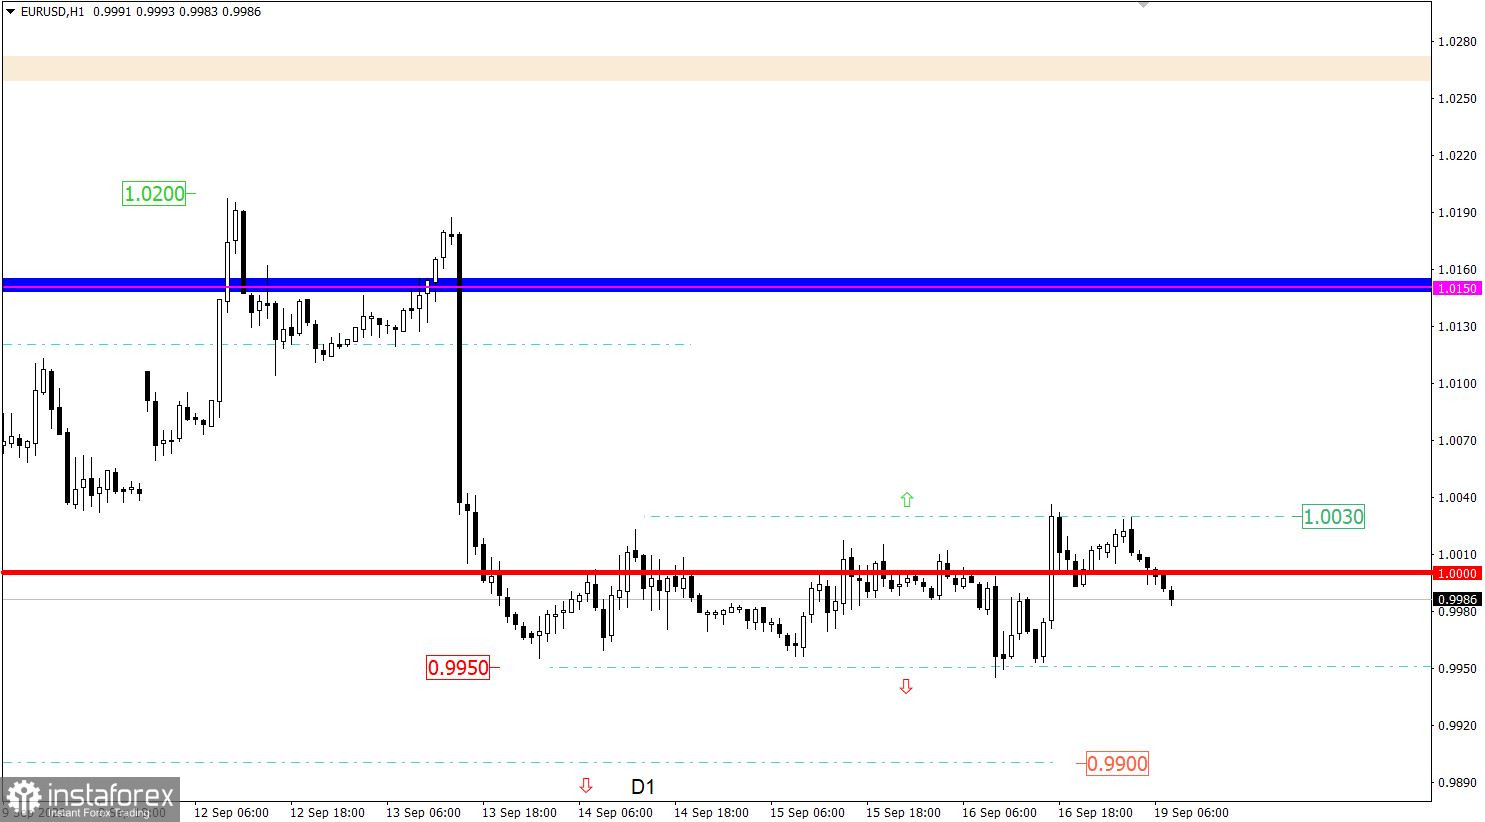
The EURUSD currency pair, despite the local manifestation of activity, is still moving within the sideways range of 0.9950/1.0030. This price movement indicates the process of accumulation of trading forces, which will most likely lead to a surge in activity during the completion of the side formation.
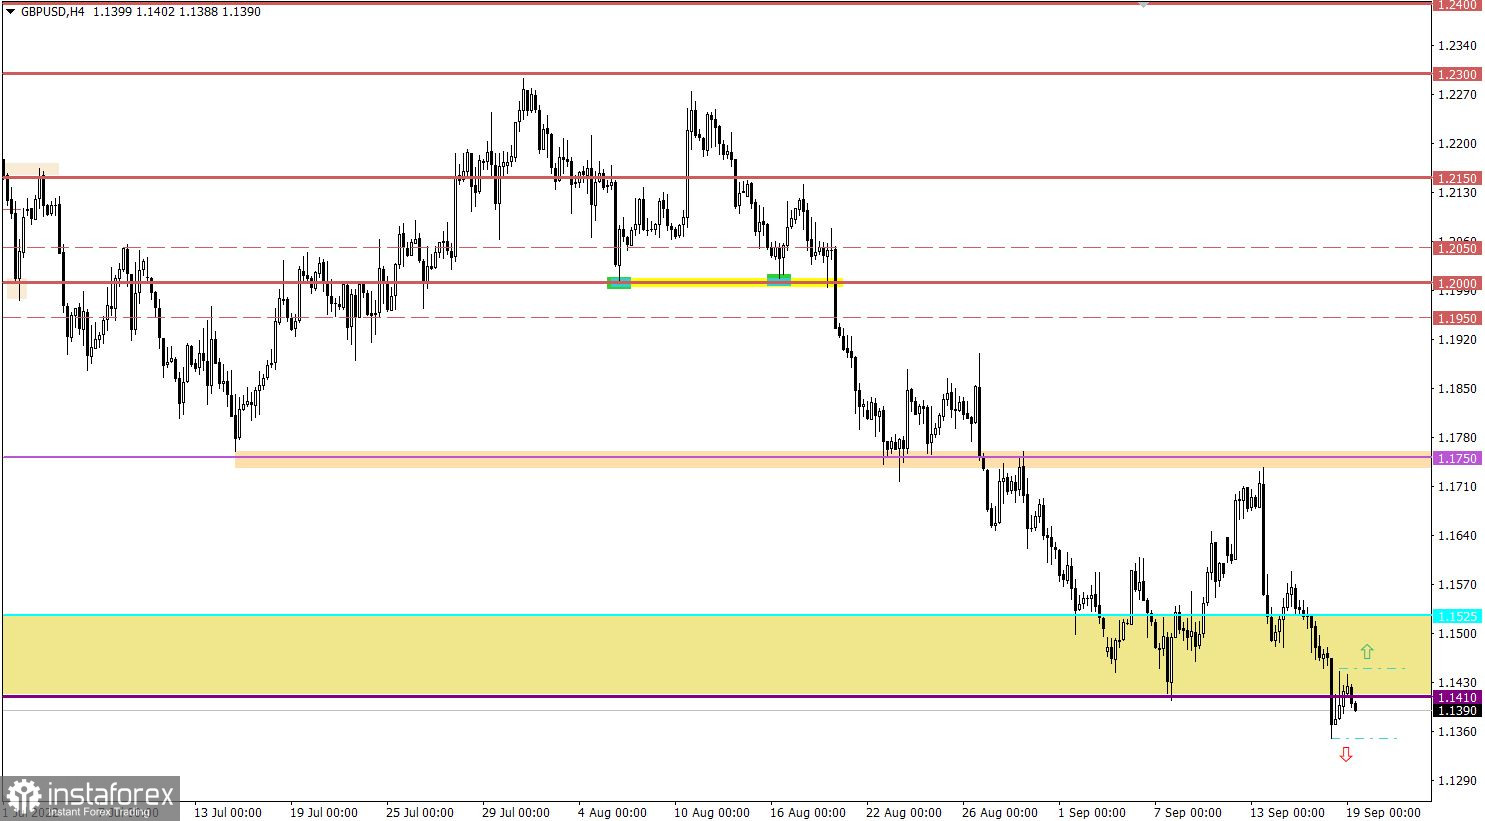
The GBPUSD currency pair ended last week with an update of the local lows of the downward trend. As a result, the quote was at the levels of 1985, where overheating of short positions on the pound led to a technical pullback of about 90 points.

Economic calendar for September 19
The new trading week starts with a blank macroeconomic calendar. Important statistics in Europe and the United States are not expected. While trading is closed in the UK due to the funeral of Queen Elizabeth II.
Investors and traders will be guided by the information flow, identifying possible speeches / statements / comments regarding interest rates, inflation, and everything related to monetary policy.
Trading plan for EUR/USD on September 19
In this situation, work within the established range is possible, but the outgoing impulse method is considered the most optimal strategy in terms of income and risk.
We concretize the above:
The downward movement will be relevant after holding the price below 0.9950 in a four-hour period. This move could result in a new downward trend low.
An upward movement in the currency pair is taken into account in case of a stable holding of the price above the value of 1.0030 in a four-hour period.

Trading plan for GBP/USD on September 19
Despite the current pullback, the market still has a technical signal about the oversold pound sterling. For this reason, the price movement above the value of 1.1450 will lead to the subsequent recovery of the British currency.
At the same time, the update of the local low of the downward trend has led to the emergence of an inertial move on the market, where the speculative mood may well ignore all the emerging signals from technical analysis. In this case, keeping the price below the value of 1.1350 may lead to a subsequent increase in the volume of short positions in the pound sterling.

What is shown in the trading charts?
A candlestick chart view is graphical rectangles of white and black light, with sticks on top and bottom. When analyzing each candle in detail, you will see its characteristics of a relative period: the opening price, closing price, and maximum and minimum prices.
Horizontal levels are price coordinates, relative to which a stop or a price reversal may occur. These levels are called support and resistance in the market.
Circles and rectangles are highlighted examples where the price of the story unfolded. This color selection indicates horizontal lines that may put pressure on the quote in the future.
The up/down arrows are the reference points of the possible price direction in the future.


