


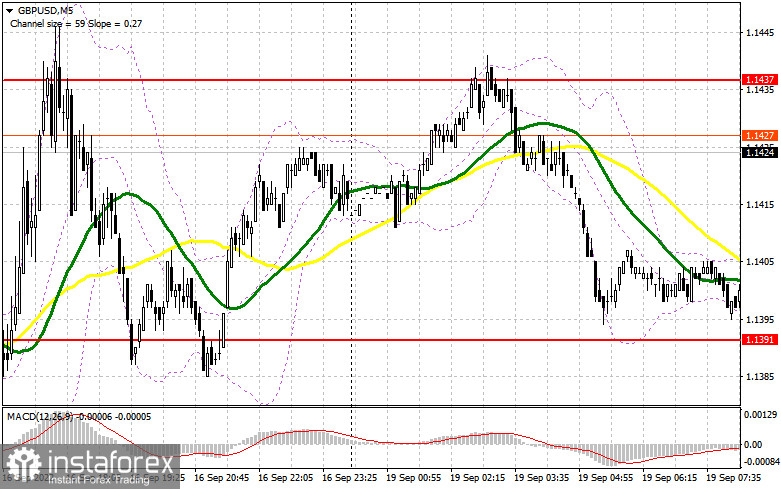
Yesterday, traders received a perfect signal to enter the market. Let us take a look at the 5-minute chart to clear up the market situation. Earlier, I asked you to pay attention to the level of 1.1437 to decide when to enter the market. A rise in the pound sterling in the second part of the day led to a false breakout of 1.1437 and a perfect sell signal. As a result, the pair dropped by more than 40 pips.
Conditions for opening long positions on GBP/USD:
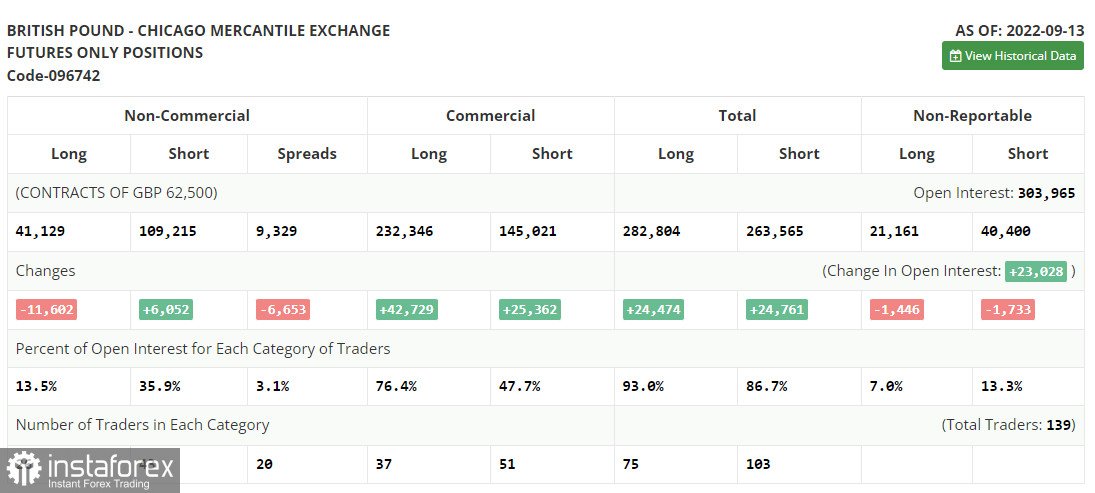
Before we focus on the technical picture of the pound sterling, let us find out what happened on the futures market. According to the COT report from September 13, the number of short positions increased, whereas the number of the long ones dropped. This fact once again proves that the pound sterling is following a strong downtrend, which is very difficult to stop. This week, both the Federal Reserve and the Bank of England will hold a meeting. The BoE is expected to raise the benchmark rate. This decision may have a negative effect on the economy, which is slipping toward recession. The worsening of the economic conditions is proved by macroeconomic figures. The recent speech provided by BoE Governor Andrey Bailey is reflecting the regulator's aggressive approach. On the one hand, higher interest rates should boost the British currency. On the other hand, traders are selling off the currency amid the economic slowdown and cost of living crisis. Against the backdrop, demand for the US dollar is mounting. The greenback is also gaining popularity thanks to the key interest rate hike. The recent COT report unveiled that the number of long non-commercial positions declined by 11,602 to 41,129, whereas the number of short non-commercial positions added 6,052 to total 109,215. As a result, the negative value of the non-commercial net position jumped to -68,086 from -50,423. The weekly closing price collapsed from 1.1504 to 1.1526.
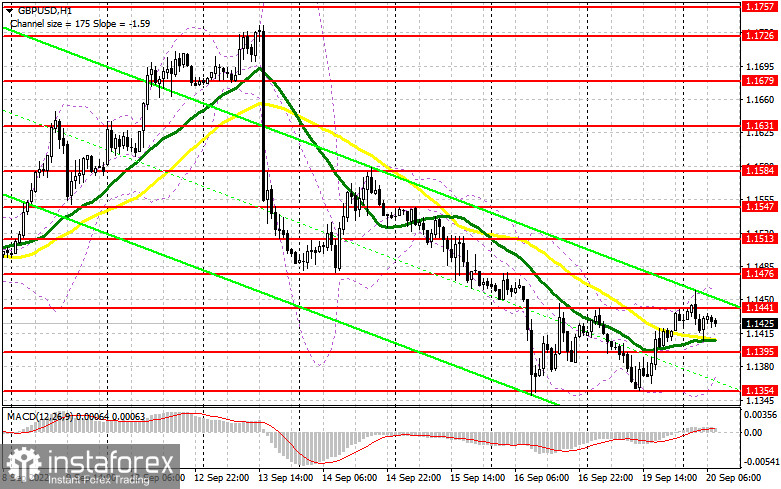
Today, the UK will not publish any report that may exert pressure on the pound sterling. Recently, it has been the fundamental data that has been pushing the pound sterling to new yearly lows. Yesterday, the currency managed to rebound from the bottom of the downtrend. However, a further rise highly depends on the FOMC meeting that will take place tomorrow. Today, the British pound is likely to go on growing. Thus, it will be better to buy the currency after a decline and a false breakout of the middle level of the sideways channel located at 1.1395. In this case, the asset may return to 1.1441. If the price exceeds this level, it will have a chance to climb higher. A breakout of 1.1441 and a downward test of this level will allow the pair to reach 1.1476. The next target is located at 1.1513, where it is recommended to lock in profits. If the pound/dollar pair decreases and buyers fail to protect 1.1395, pressure on the currency will increase. In this case, only one support level will separate the pair from a fresh yearly low. If the predictions come true, traders should avoid long positions until the price hits 1.1354. There, buy orders could be initiated only after a false breakout. Traders may also go long after a bounce off 1.1313 or near the low of 1.1264, expecting a correction of 30-35 pips.
Conditions for opening short positions on GBP/USD:
Today, bears should primarily protect the nearest resistance level of 1.1441. They should not allow the pair to go above this level since this may cause numerous buy orders ahead of the Fed meeting. If the pair advances, only a false breakout of 1.1441 will put pressure on the pound sterling and form a sell signal with the target at the nearest support level of 1.1395. A breakout and an upward test of 1.1395 will give a sell signal with the target at 1.1354. The next target is located at 1.1313, where it is recommended to lock in profits. If the pair hits this level, it will resume falling. If the pair increases and bears fail to protect 1.1441, buyers will regain control over the market, allowing the pair to climb to 1.1476. A false breakout of this level will give a short signal. If bears fail to be active, the pair may jump to the high of 1.1513. There, traders may sell the asset just after a rebound, expecting a drop of 30-35 pips.
Signals of indicators:
Moving Averages
Trading is performed near the 30- and 50-day moving averages. It means that sellers still have a chance to push the price lower.
Note: The period and prices of moving averages are considered by the author on the one-hour chart, which differs from the general definition of the classic daily moving averages on the daily chart.
Bollinger Bands
If the price breaks the lower limit of the indicator located at 1.1380, pressure on the pair will increase. A breakout of the upper limit of the indicator located at 1.1440, will allow the pound sterling to gain in value.
Description of indicators
- Moving average (moving average, determines the current trend by smoothing volatility and noise). The period is 50. It is marked in yellow on the chart.
- Moving average (moving average, determines the current trend by smoothing volatility and noise). The period is 30. It is marked in green on the graph.
- MACD indicator (Moving Average Convergence/Divergence - convergence/divergence of moving averages). A fast EMA period is 12. A slow EMA period is 26. The SMA period is 9.
- Bollinger Bands. The period is 20.
- Non-profit speculative traders are individual traders, hedge funds, and large institutions that use the futures market for speculative purposes and meet certain requirements.
- Long non-commercial positions are the total number of long positions opened by non-commercial traders.
- Short non-commercial positions are the total number of short positions opened by non-commercial traders.
- The total non-commercial net position is a difference in the number of short and long positions opened by non-commercial traders.


