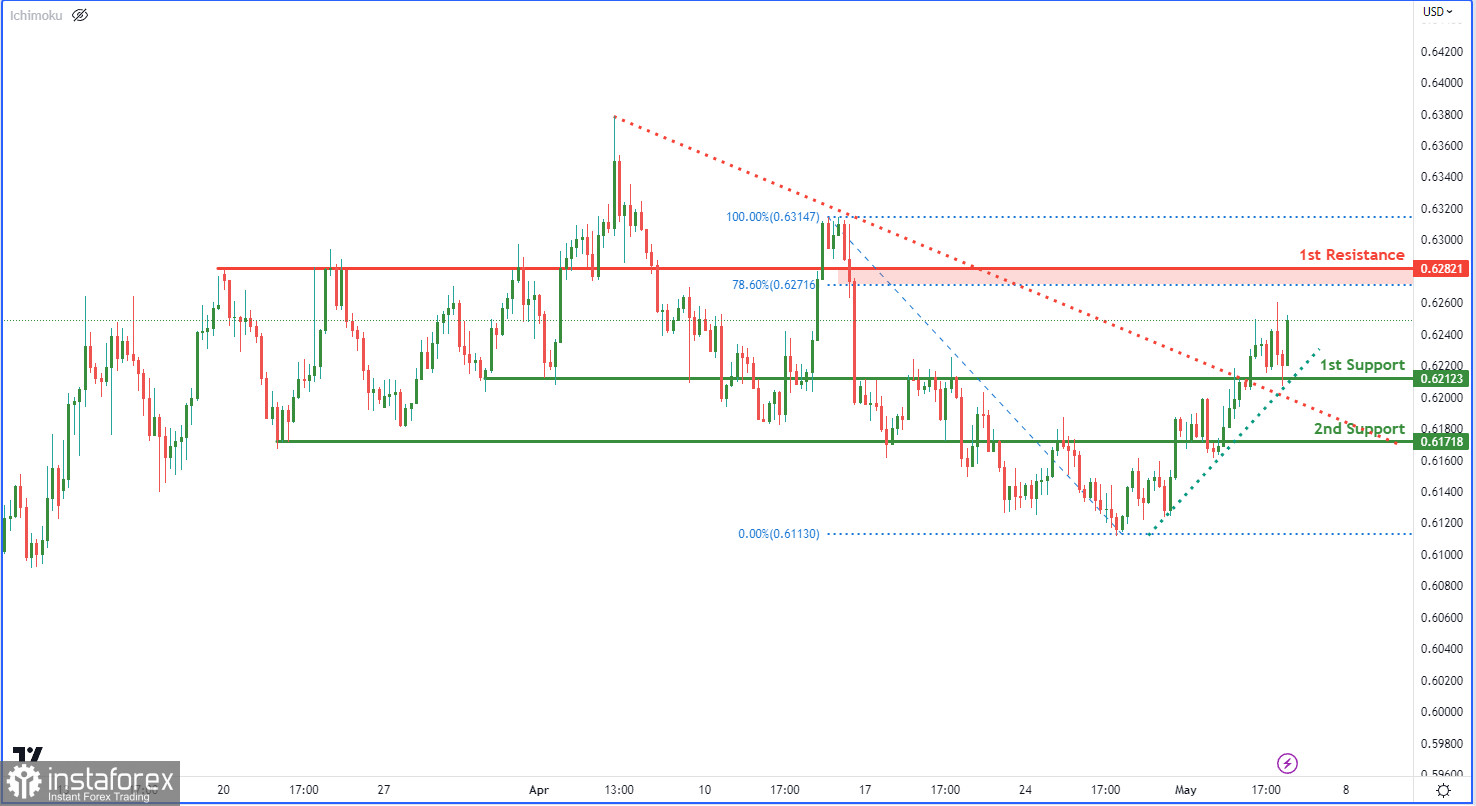
The NZD/USD chart indicates bullish momentum with price positioned above a significant ascending trend line, suggesting potential for further bullish momentum. Moreover, the recent breakout above a descending resistance line has triggered a possible bullish move.
Looking ahead, a potential bullish continuation towards the first resistance level of 0.6282 could occur. In case of a drop in price, the first support level at 0.6212, which is an overlap support, may provide initial support. The second support level at 0.6171, also an overlap support, could provide further support if the price falls below the first support level.
As for resistance, the first resistance level at 0.6282 is a pullback resistance. If the price manages to break above this level, it could potentially rise towards higher levels.


