


Analysis of Wednesday's deals:
30M chart of the EUR/USD pair
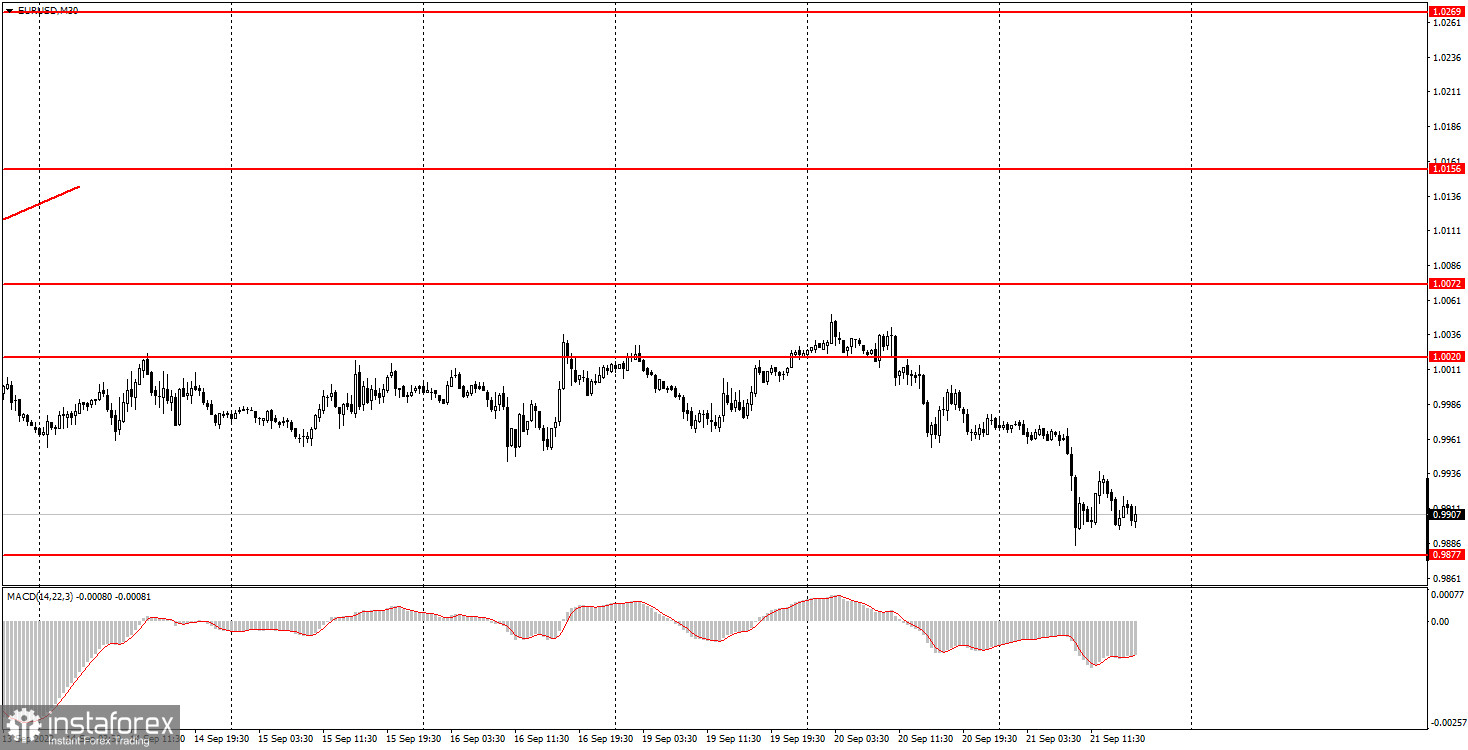
The EUR/USD currency pair made an impressive somersault in the early morning. The euro's quotes fell another 70 points in just 1.5 hours, after which the downward movement stalled, but an upward correction did not begin either. Thus, the pair is now only 20 points away from its 20-year lows and could drop lower at any time. In fact, we have repeatedly said that the downward trend is not over, and in 2022 we can see more than one update of 20-year lows. So far, our prediction is correct. Of course, tonight's event may make serious adjustments to the current technical picture, but we believe that the fundamental background will not change dramatically, no matter what steps the Federal Reserve takes. Recall that the results of the US central bank meeting will be announced, as well as a speech by Fed Chairman Jerome Powell. Naturally, after these events, volatility can jump sharply, and the pair can move in any direction with equal probability. Moreover, the market reaction to this event can persist for quite a long time, for example, all tomorrow, because the European markets will not be able to work out the Fed meeting in the evening (they will be closed), the US markets will have only 1-2 hours to win back. Therefore, the movement on Thursday may be no less strong than on Wednesday evening.
5M chart of the EUR/USD pair
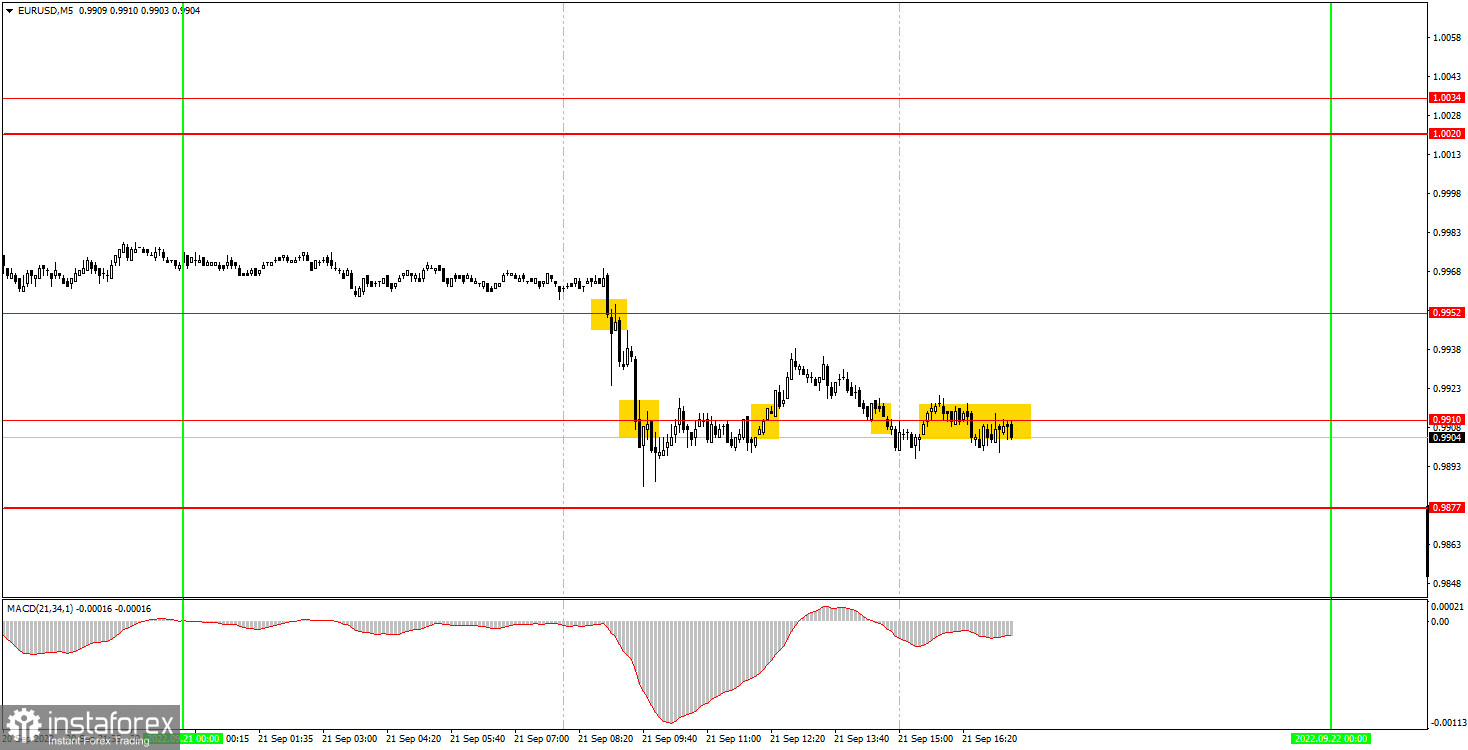
The situation with trading signals on the 5-minute timeframe was average. As we have already said, the pair fell sharply at the beginning of the European trading session, but then a blatant flat began - the market went into standby mode. Therefore, the first signal to sell brought profit to beginners - quotes fell even below the level of 0.9910. The position should have been closed when the price consolidated back above 0.9910, which brought a profit of 23 points. The same signal to buy should have been worked out with a long position, but the price went up only 15 points, which was enough to set Stop Loss to breakeven. The deal on this Stop Loss was closed. The remaining two signals near the 0.9910 level should have been ignored because the first two turned out to be false.
How to trade on Thursday:
The pair shows that it is ready to continue the fall on the 30-minute timeframe. The flat lasted five days, but now it is over. The Fed meeting and the technical picture may undergo significant changes in the evening. However, the overall picture of the state of affairs is unlikely to change dramatically. On the 5-minute time frame, it is recommended to trade at the levels (Wednesday low), 0.9877, 0.9910, 0.9952, 1.0020-1.0034, 1.0072, 1.0123, 1.0156. When passing 15 points in the right direction, you should set Stop Loss to breakeven. No major events scheduled for Thursday in the US or the EU. The unemployment claims report is clearly not important. Moreover, the market will be busy playing back the results of the Fed meeting. In addition, attention will shift to the Bank of England, which will announce the results of its meeting on Thursday. Volatility can be very high and should be traded with caution.
Basic rules of the trading system:
1) The signal strength is calculated by the time it took to form the signal (bounce or overcome the level). The less time it took, the stronger the signal.
2) If two or more deals were opened near a certain level based on false signals (which did not trigger Take Profit or the nearest target level), then all subsequent signals from this level should be ignored.
3) In a flat, any pair can form a lot of false signals or not form them at all. But in any case, at the first signs of a flat, it is better to stop trading.
4) Trade deals are opened in the time period between the beginning of the European session and until the middle of the US one, when all deals must be closed manually.
5) On the 30-minute TF, using signals from the MACD indicator, you can trade only if there is good volatility and a trend, which is confirmed by a trend line or a trend channel.
6) If two levels are located too close to each other (from 5 to 15 points), then they should be considered as an area of support or resistance.
On the chart:
Support and Resistance Levels are the Levels that serve as targets when buying or selling the pair. You can place Take Profit near these levels.
Red lines are the channels or trend lines that display the current trend and show in which direction it is better to trade now.
The MACD indicator (14,22,3) consists of a histogram and a signal line. When they cross, this is a signal to enter the market. It is recommended to use this indicator in combination with trend lines (channels and trend lines).
Important speeches and reports (always contained in the news calendar) can greatly influence the movement of a currency pair. Therefore, during their exit, it is recommended to trade as carefully as possible or exit the market in order to avoid a sharp price reversal against the previous movement.
Beginners on Forex should remember that not every single trade has to be profitable. The development of a clear strategy and money management are the key to success in trading over a long period of time.


