


EUR/USD 5M
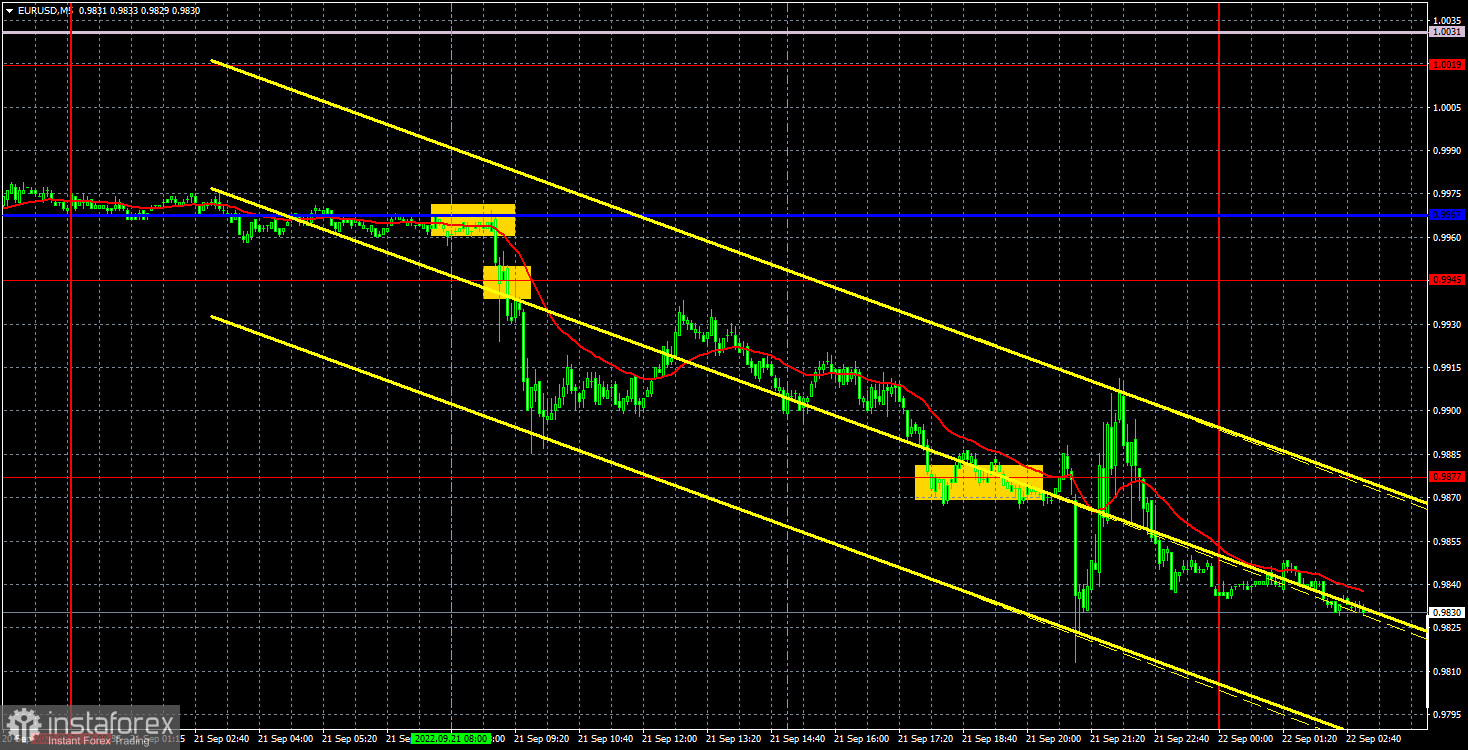
The EUR/USD pair sharply resumed its downward movement on Wednesday and dropped to the lower border of the 0.9877-1.0072 horizontal channel. This border was even overcome, that is, the pair again updated its 20-year lows. Moreover, all this happened even before the announcement of the results of the Federal Reserve meeting, which we deliberately do not consider now, since the market needs to be given time to fully work them out. Moreover, in any case, traders had to leave the market before the announcement of the results, since we do not recommend trading in the evening and at night. During the day, there were no important events either in the US or in the European Union, so we can't immediately explain the euro's new fall at first glance. However, at a second glance, everything is clear. In the morning, Russia announced a partial mobilization to participate in the military conflict in Ukraine. In the evening, rallies against mobilization were held throughout Russia, but it is clear to everyone that the geopolitical situation in Ukraine may worsen in the near future. And if geopolitics worsens again, then the euro and the pound again fall into the risk zone, since the dollar is in high demand in such situations.
It should be noted right away that the Kijun-sen line fell to the level of 0.9967 during the past day, and it was from this level that the price rebounded during the European trading session. Therefore, the first sell signal was formed at the very beginning of the downward movement. Subsequently, the price overcame the level of 0.9945, and it was also possible to open short positions on this signal. As a result, by the middle of the US session, the quotes dropped to the level of 0.9877, where it was necessary to close positions in profit of about 65 points.
COT report:

The Commitment of Traders (COT) reports on the euro in the last few months clearly reflect what is happening in the euro/dollar pair. For half of 2022, they showed a blatant bullish mood of commercial players, but at the same time, the euro fell steadily at the same time. At this time, the situation is different, but it is NOT in favor of the euro. If earlier the mood was bullish, and the euro was falling, now the mood is bearish and... the euro is also falling. Therefore, for the time being, we do not see any grounds for the euro's growth, because the vast majority of factors remain against it. During the reporting week, the number of long positions for the non-commercial group increased by 2,500, while the number of shorts decreased by 22,000. Accordingly, the net position grew by about 24,500 contracts. This is quite a lot and we can talk about a significant weakening of the bearish mood. However, so far this fact does not give any dividends to the euro, which still remains "at the bottom". The only thing is that in recent weeks it has done without another collapse, unlike the pound. At this time, commercial traders still do not believe in the euro. The number of longs is lower than the number of shorts for non-commercial traders by 12,000. This difference is no longer too large, so one could expect the start of a new upward trend, but what if the demand for the US dollar remains so high that even the growth in demand for the euro does not save the situation for the euro/dollar currency pair?
We recommend to familiarize yourself with:
Overview of the EUR/USD pair. September 22. Lagarde speech: "water" on "water".
Overview of the GBP/USD pair. September 22. New geopolitical tensions in Ukraine, partial mobilization in Russia.
Forecast and trading signals for GBP/USD on September 22. Detailed analysis of the movement of the pair and trading transactions.
EUR/USD 1H
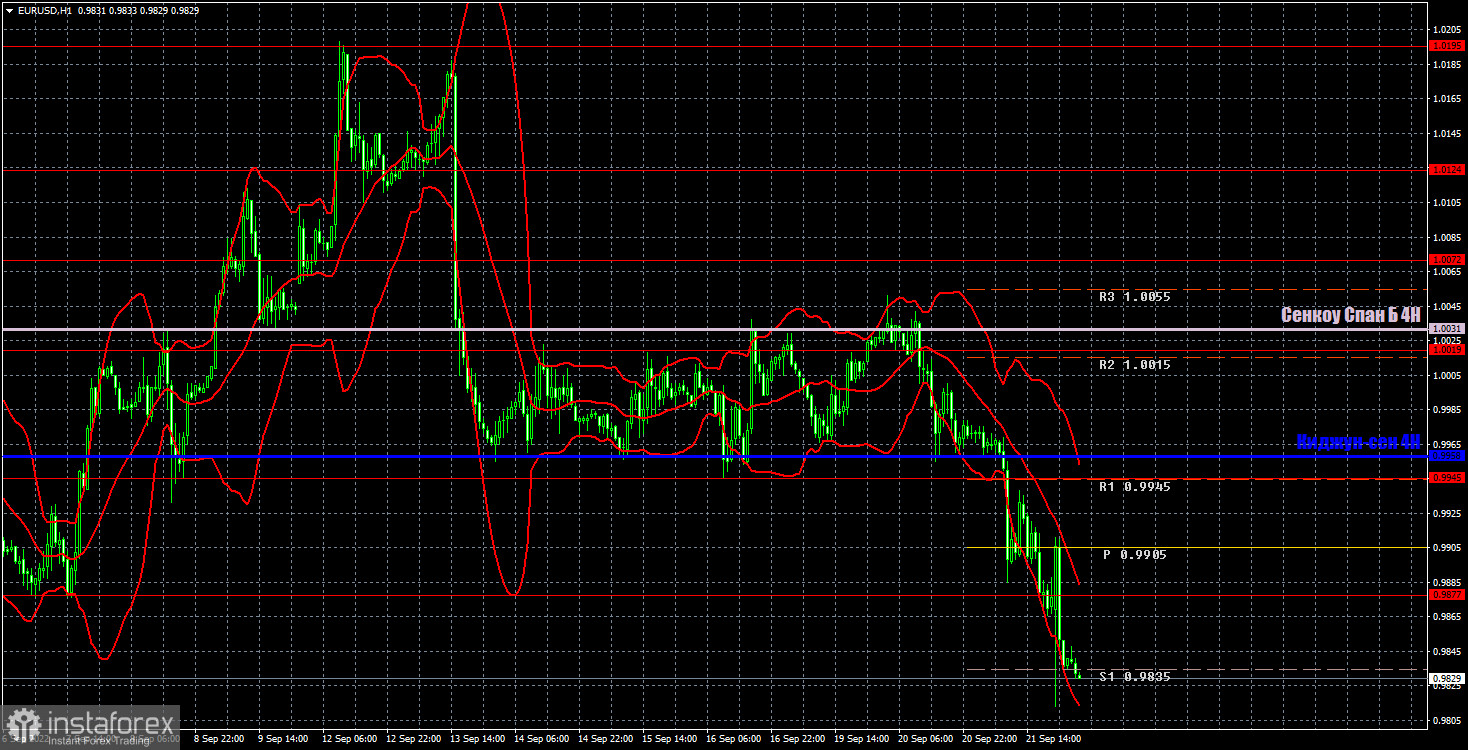
The outlook for the bears remains very good on the hourly timeframe. Summing up the results of the Fed meeting and analyzing the final reaction of the market should be done only in the late afternoon, so we do not consider the movements that happened last night. However, in any case, the global downtrend persists, so the euro may update its 20-year lows more than once this year. We highlight the following levels for trading on Thursday - 0.9877, 0.9945, 1.0019, 1.0072, 1.0124, 1.0195, 1.0269, as well as Senkou Span B (1.0031) and Kijun-sen lines (0.9958). Ichimoku indicator lines can move during the day, which should be taken into account when determining trading signals. There are also secondary support and resistance levels, but no signals are formed near them. Signals can be "rebounds" and "breakthrough" extreme levels and lines. Do not forget about placing a Stop Loss order at breakeven if the price has gone in the right direction for 15 points. This will protect you against possible losses if the signal turns out to be false. Not a single important event is planned in the European Union and the Untied States on September 22. But even if they were, the market would hardly pay attention to them, since, most likely, it will be busy working out the results of the Fed meeting.
Explanations for the chart:
Support and Resistance Levels are the levels that serve as targets when buying or selling the pair. You can place Take Profit near these levels.
Kijun-sen and Senkou Span B lines are lines of the Ichimoku indicator transferred to the hourly timeframe from the 4-hour one.
Support and resistance areas are areas from which the price has repeatedly rebounded off.
Yellow lines are trend lines, trend channels and any other technical patterns.
Indicator 1 on the COT charts is the size of the net position of each category of traders.
Indicator 2 on the COT charts is the size of the net position for the non-commercial group.


