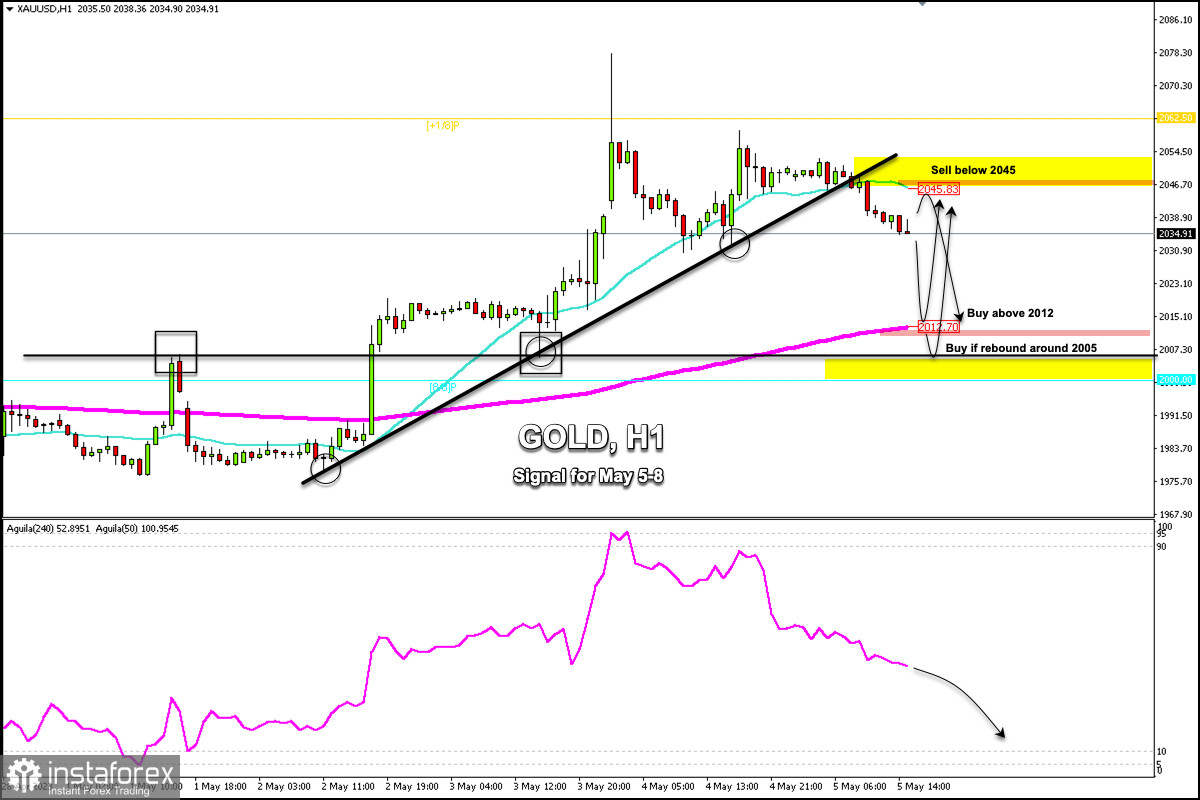
Early in the American session, we can see that Gold (XAU/USD) is trading around 2,034.91, below the 21 SMA, and below the +1/8 Murray located at 2,062.
On the 1-hour chart, we can see that gold has broken out of the uptrend channel formed since May 2. Downside pressure is likely to persist if the NonFarm Payrolls data comes out positive for the US.
We could expect XAU/USD to continue lower and reach the 200 EMA located at 2,012. Ultimately, the metal could fall towards R_2 daily support of about 2,005.
In case of a rebound from about 2,012 (200 EMA) or 2,005 (R_2 daily), a recovery of gold could occur, since a strong weekly support is located at both levels, which coincides with the high reached on May 1 and now this level has become a key support.
Conversely, in case of a pullback to the 21 SMA located at 2,045, we could see this as a clear signal to sell due a strong weekly resistance found in this area.
In case this scenario comes true, we should expect a price rejection below 2,050 and gold is likely to fall because the Eagle indicator is showing negative signs which are likely to be exploited as an opportunity to sell.


