


GBP/USD 5M
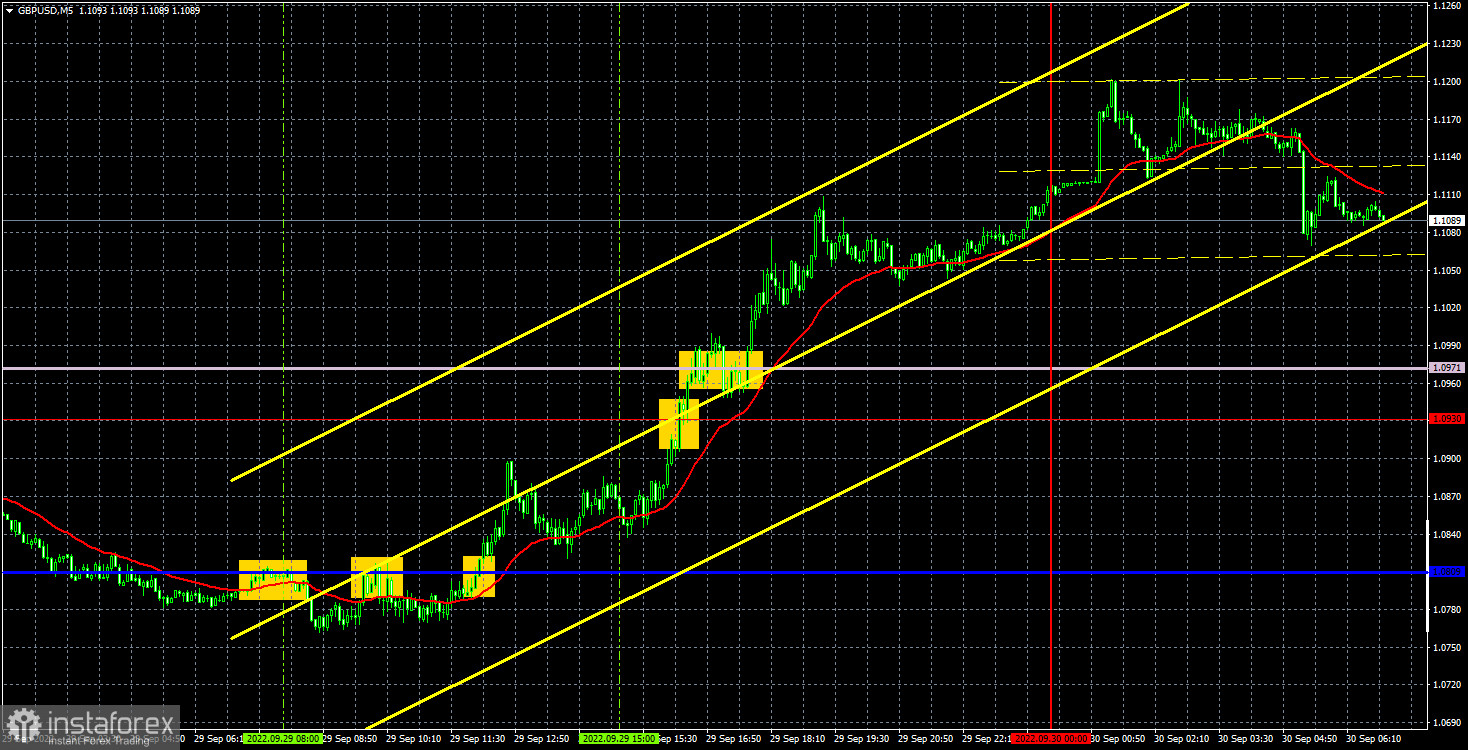
The GBP/USD currency pair traded almost identical to the EUR/USD pair again on Thursday. Thus, the British currency has been growing for a whole week. With what exactly is growing, and not pretending to grow. From the lows of the current week (and at the same time the absolute lows), the pound has already managed to rise in price by 800 points. We spoke about such a movement in the context of the question of the beginning of a new upward trend. Now we can only hope that in the near future the market will not face a new portion of disappointing statistics or news. There was practically no important data yesterday. It is unlikely that a strong move up, which lasts four full days, can be linked to the US GDP report in the second quarter in the third assessment. GDP fell by 0.6%, but traders already knew that this would be the case. The American economy has been in recession for two quarters, but the dollar has already won back all conceivable and unimaginable factors of its own growth. Now the dollar's growth can only happen in case we receive new shocking news of a geopolitical nature.
There were no problems with yesterday's trading signals. The first two signals in the form of rebounds from the Kijun-sen line were false. In both cases, the price went down by about 20 points, so Stop Loss should have been placed at breakeven on both short positions. At the same time, some of them might not work. In any case, the third buy signal should have been worked out. Perhaps it was risky, but the risk was worth it, given that for the first time in a long time, the pound began to rise. The pair then broke through the 1.0930 level and the Senkou Span B, moving up about 230 points in total through Thursday evening. This is the level of profit that traders could get by working out this signal.
COT report:
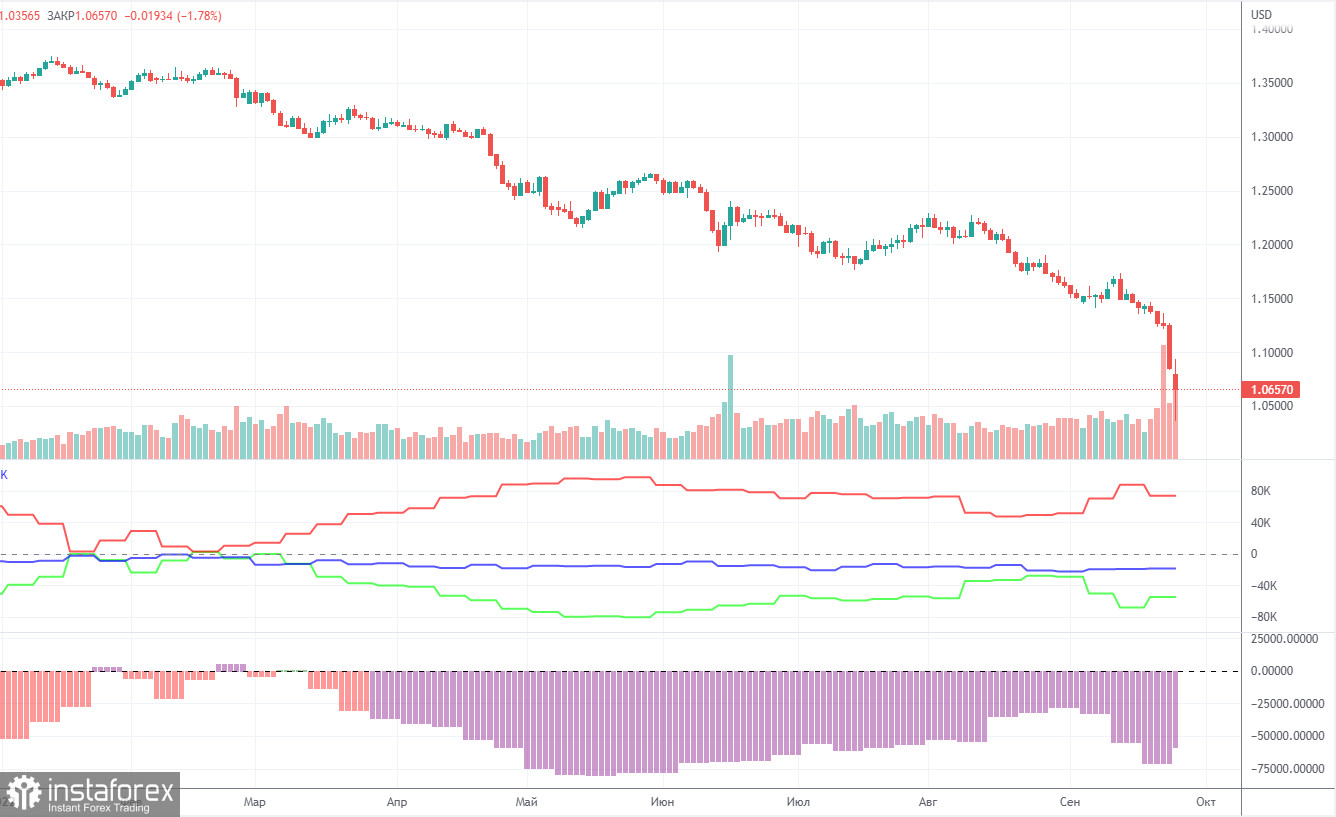
The latest Commitment of Traders (COT) report on the British pound was again very eloquent. During the week, the non-commercial group closed 11,600 long positions and opened 6,000 short positions. Thus, the net position of non-commercial traders decreased by another 17,600, which is a lot for the pound. The net position indicator has been growing for several months, but the mood of the big players still remains "pronounced bearish", which is clearly seen in the second indicator in the chart above (purple bars below zero = bearish mood). And now it has begun a new decline, so the British pound still cannot count on a strong growth. How can you count on it if the market sells the pound more than it buys? And now its decline has completely resumed and multi-year lows are updated almost every day, so the bearish mood of major players can only intensify in the near future. The non-commercial group now has a total of 109,000 shorts and 41,000 longs open. The difference is again almost threefold. The net position will have to show growth for a long time to at least equalize these figures. Moreover, one should not forget about the high demand for the US dollar, which also plays a role in the fall of the pound/dollar pair.
We recommend to familiarize yourself with:
Overview of the EUR/USD pair. September 30. We understand the reasons why the euro can resume its fall.
Overview of the GBP/USD pair. September 30. The British pound, as usual, has a lot of problems.
Forecast and trading signals for EUR/USD on September 30. Detailed analysis of the movement of the pair and trading transactions.
GBP/USD 1H
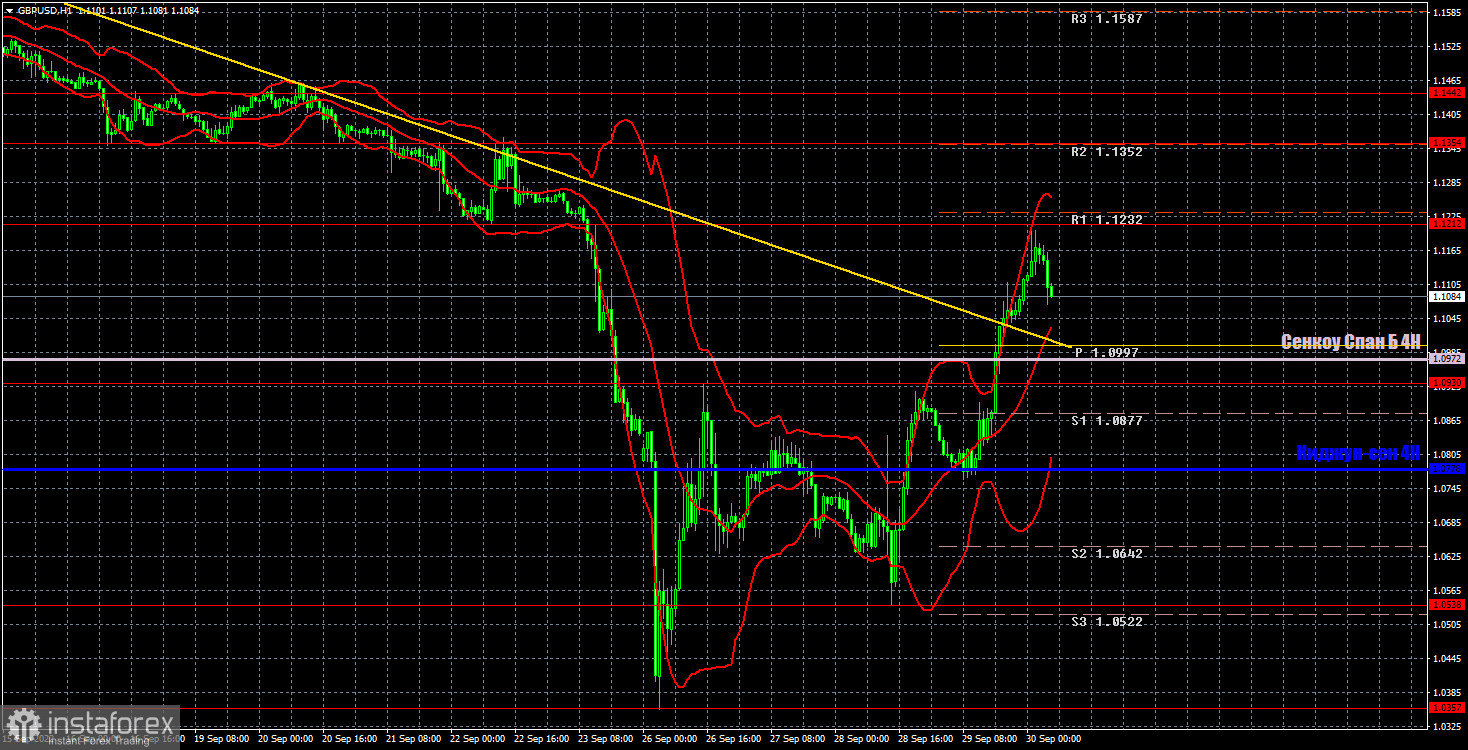
The pound/dollar pair, as we see it now, has broken the downward trend on the hourly timeframe, as all key levels and lines have been overcome. We can only hope that now the pound will consolidate above the Senkou Span B line at least for a week. In this case, we can expect the formation of a new upward trend. Reasons for it are no longer required, since the pound is heavily oversold. For September 30, we highlight the following important levels: 1.0538, 1.0930, 1.1212, 1.1354, 1.1442. Senkou Span B (1.0972) and Kijun-sen (1.0778) lines can also be sources of signals. Signals can be "rebounds" and "breakthroughs" of these levels and lines. The Stop Loss level is recommended to be set to breakeven when the price passes in the right direction by 20 points. Ichimoku indicator lines can move during the day, which should be taken into account when determining trading signals. The chart also contains support and resistance levels that can be used to take profits on trades. The UK will publish a report on GDP for the second quarter, but given how briskly the pound is currently trading, we believe that this report will not affect the pair's movement in any way. In the US, we only have secondary reports, such as personal income and expenses of the American population and the consumer confidence index from the University of Michigan.
Explanations for the chart:
Support and Resistance Levels are the levels that serve as targets when buying or selling the pair. You can place Take Profit near these levels.
Kijun-sen and Senkou Span B lines are lines of the Ichimoku indicator transferred to the hourly timeframe from the 4-hour one.
Support and resistance areas are areas from which the price has repeatedly rebounded off.
Yellow lines are trend lines, trend channels and any other technical patterns.
Indicator 1 on the COT charts is the size of the net position of each category of traders.
Indicator 2 on the COT charts is the size of the net position for the non-commercial group.


