


GBP/USD
Brief analysis:
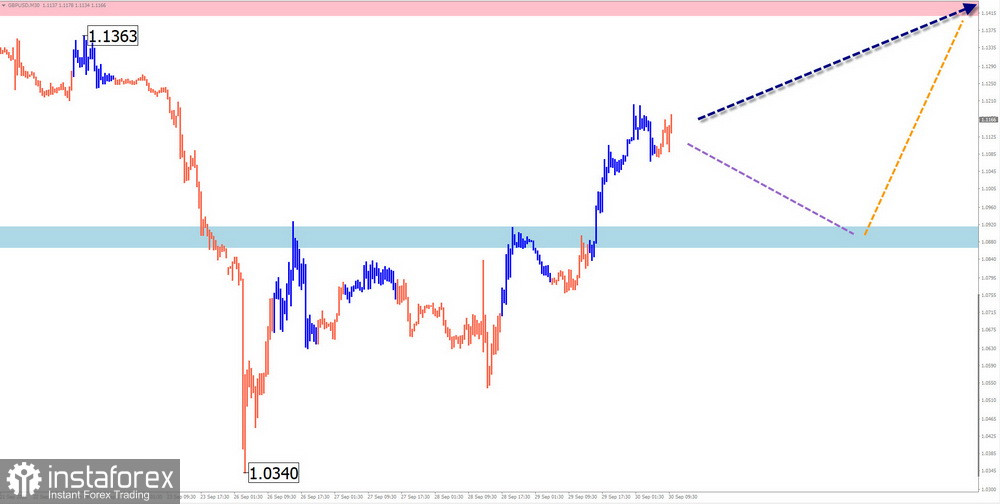
The trajectory of the pound sterling has rapidly changed over the past week. Many signs indicate that the downtrend that has been going on for the past six months has finally come to an end. Since September 26, the price has been forming an ascending wave of higher structure from a very strong support zone. The movement is now observed on the H4 time frame and continues to expand further. Yet, an interim correction is likely to start within this new bullish wave.
Weekly forecast:
At the start of the next week, the likelihood of the sideways movement is rather high. A further decline below the support zone is unlikely. Volatility is expected to increase in the second half of the week. The pair may resume the uptrend and rise towards the estimated resistance level where another pause is possible.
Potential reversal zones:
Resistance:
- 1.1410/1.1460
Support:
- 1.0920/1.0870
Recommendations:
Sell: only with small lots within limited sessions; the downside potential is low.
Buy: when confirmation signals appear near the support zone.
AUD/USD
Brief analysis:
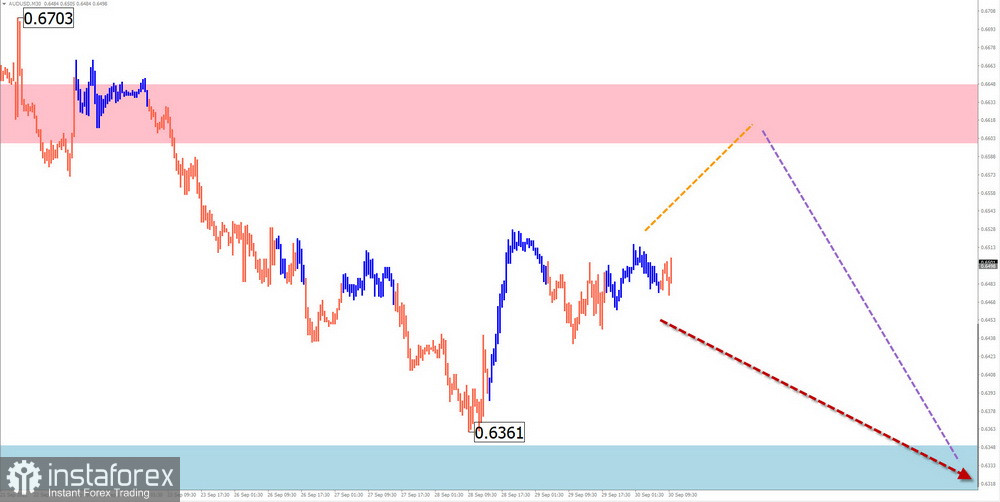
The Australian dollar has been trading within the descending wave since February last year. The incomplete section of the wave was formed on August 11. There is a hidden correction observed within its structure. For the past three days, the final section of the structure is being formed.
Weekly forecast:
The pair is expected to continue its rise in the coming days and may even hit the resistance zone. Then, the quote may reverse and resume its decline towards the support area.
Potential reversal zones:
Resistance:
- 0.6600/0.6650
Support:
- 0.6350/0.6300
Recommendations:
Buy: intraday with a fractional lot
Sell: when confirmation signals appear near the resistance zone.
USD/CHF
Brief analysis:
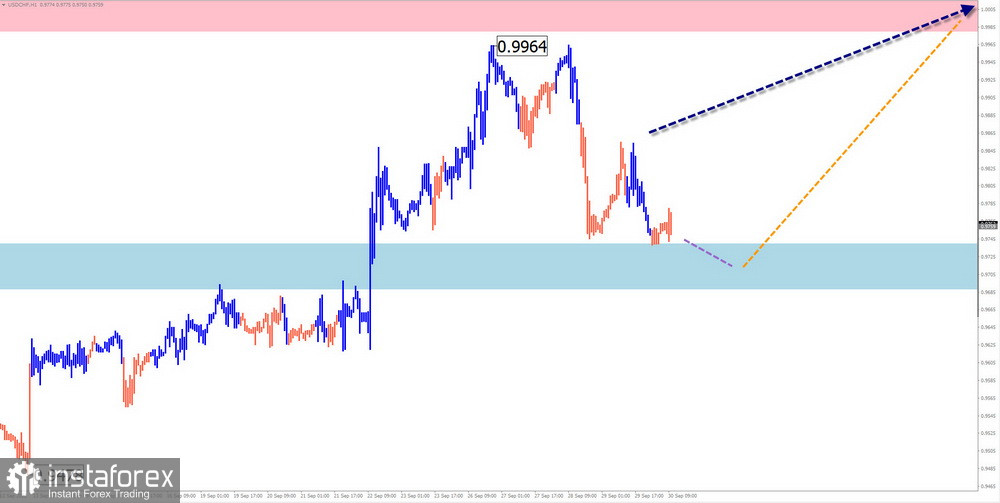
The ascending wave that was initiated on August 11 defines the trajectory of the USD/CHF pair. The price started a downside correction within the current wave from the strong resistance level formed on September 26. The ascending section of September 28 has the potential to reverse.
Weekly forecast:
At the start of the coming week, the current downside movement is likely to stop near the support zone. After that, a reversal is possible followed by the resumption of the uptrend. The price may go as far as the resistance area.
Potential reversal zones:
Resistance:
- 0.9980/1.0030
Support:
- 0.9740/0.9690
Recommendations:
Sell: not recommended in the coming days.
Buy: when confirmed buy signals appear near the support zone.
EUR/JPY
Brief analysis:
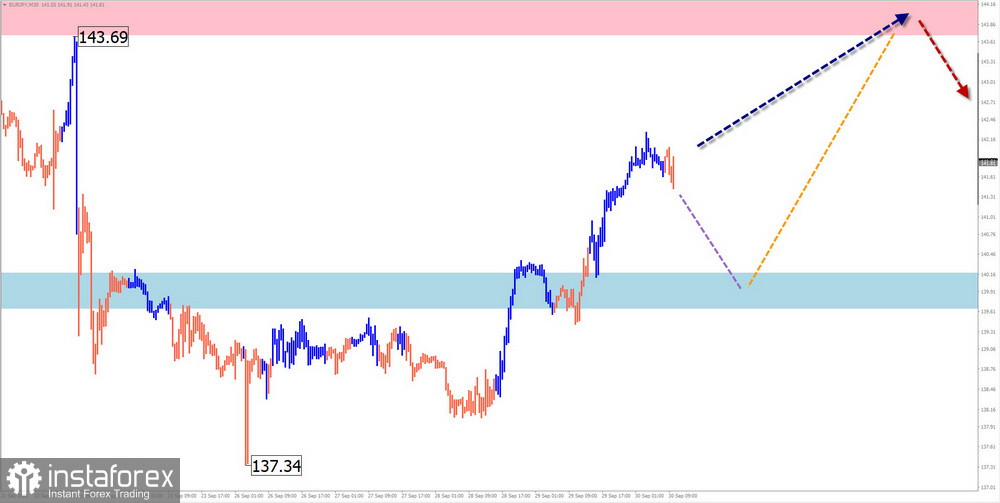
The main trajectory of the euro/yen pair is formed within the ascending wave initiated on March 7. The incomplete section of the wave started to form on August 2. In the past three weeks, the price has been forming an opposite corrective zigzag pattern (B) within this wave section. At the moment of writing, this wave has not been completed.
Weekly forecast:
The price is set to decline in the coming days. At the start of the next week, there may be a reversal and the resumption of the uptrend. Then, the quote may decline again from the resistance zone and move toward the support area.
Potential reversal zones:
Resistance:
- 143.70/144.20
Support:
- 140.20/139.70
Recommendations:
Buy: with a fractional lot at the support zone after the appropriate confirmation.
Sell: not recommended due to the weak downside potential.
Explanation: In simplified wave analysis (SWA), the wave consists of 3 parts (A-B-C). We analyze the incomplete section of the wave for a certain time frame. The expected trajectory of the price is shown by the dotted line on the chart.
Note: the wave analysis does not take into account the movement of the instrument in time!


