


Analysis of Friday's deals:
30M chart of the EUR/USD pair
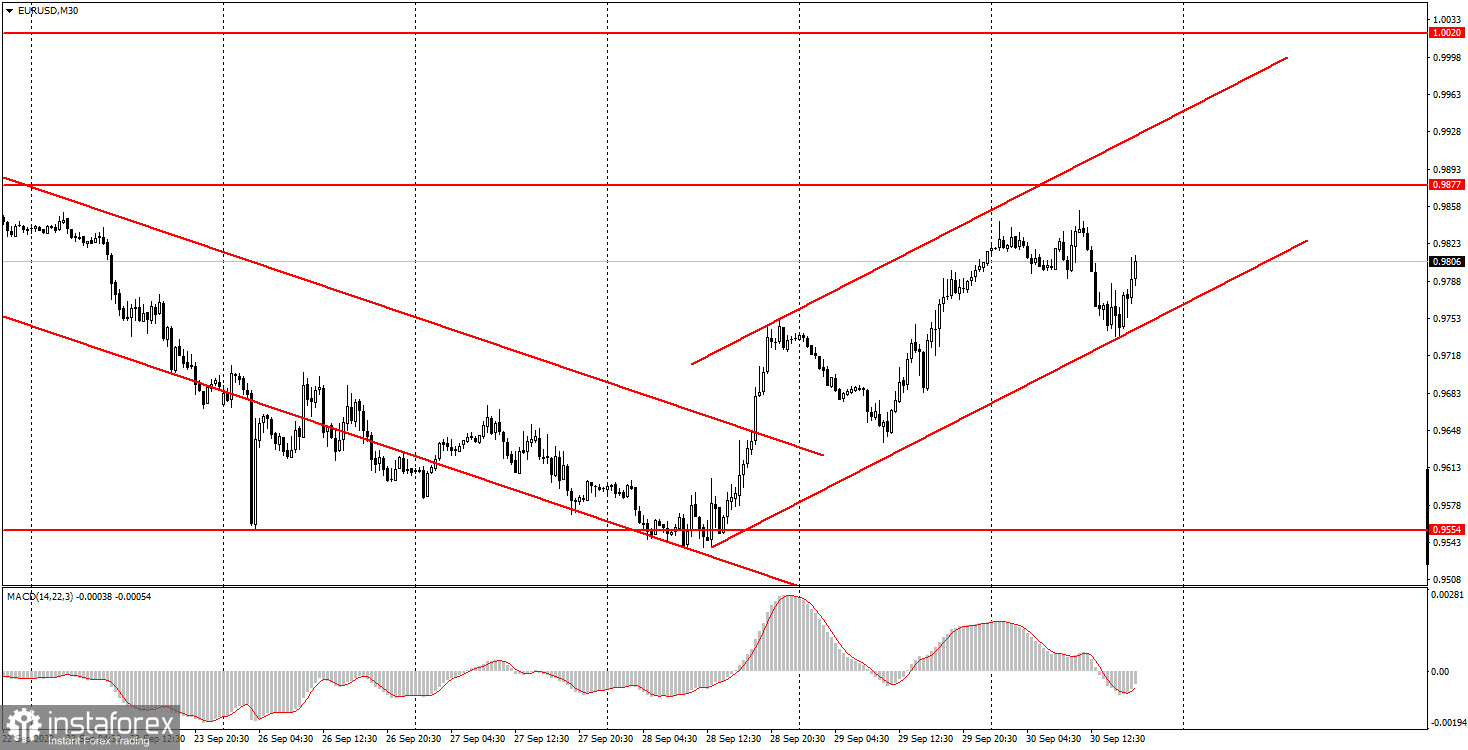
The EUR/USD currency pair traded quite actively again on Friday. In general, the euro remained in an upward trend, which now has only a few days. The trend is still clearly not pulling, but we have formed an ascending channel in order to better illustrate what is happening in the market. The key and in fact the only important macroeconomic event of the day was the release of the inflation report in the European Union. Many expected an acceleration in the consumer price index, but few expected such a strong increase. The value for September was 10%, while the previous value was 9.1% and the forecast was 9.7%. Thus, we can safely say that so far all the measures taken by the European Central Bank have not yielded any result: inflation has been growing, and growing, and even accelerating. However, this is not surprising, since two rate hikes are clearly not enough to pay it off. The market reaction to this report followed and turned out to be even quite strong - the pair went down 90 points after the release. However, the very fact that the euro fell can hardly be called logical, because the higher the inflation, the greater the chances for new and new increases in the ECB rate in an attempt to curb it. And a rate hike is a hawkish event that should support the euro. True, the market has long forgotten about it. As a result, the reaction was, but illogical.
5M chart of the EUR/USD pair
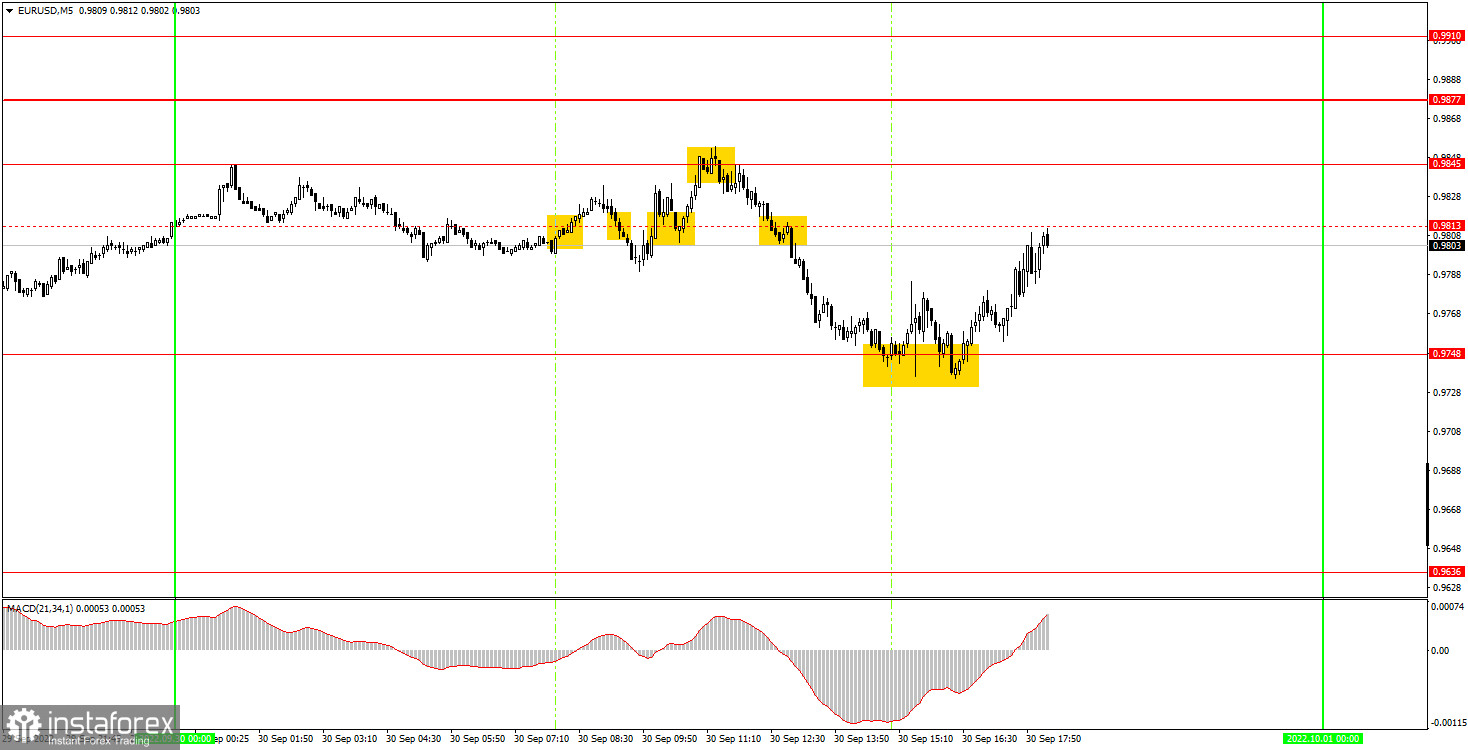
There were plenty of trading signals on the 5-minute timeframe on Friday. The first two signals near the level of 0.9813, which was recognized as irrelevant at the end of the day, were false. For the first one, even Stop Loss could not be placed, so traders received a slight loss on one transaction. All subsequent signals near the level of 0.9813 should have been ignored. Thus, the next signal to work out was formed near the level of 0.9845, which is the previous day's high, which we talked about yesterday. It was the rebound from it that led to the strongest movement during the day - to a fall to the level of 0.9748, from which a rebound also followed. As a result, beginners could earn at least 70 points in this position. A buy signal near the level of 0.9748 could also be worked out by a long position, which also made a profit, as the price rose to the level of 0.9813 and bounced off it. Therefore, the profit is another 40 points. The morning loss was covered with a vengeance.
Basic rules of the trading system:
1) The signal strength is calculated by the time it took to form the signal (bounce or overcome the level). The less time it took, the stronger the signal.
2) If two or more deals were opened near a certain level based on false signals (which did not trigger Take Profit or the nearest target level), then all subsequent signals from this level should be ignored.
3) In a flat, any pair can form a lot of false signals or not form them at all. But in any case, at the first signs of a flat, it is better to stop trading.
4) Trade deals are opened in the time period between the beginning of the European session and until the middle of the US one, when all deals must be closed manually.
5) On the 30-minute TF, using signals from the MACD indicator, you can trade only if there is good volatility and a trend, which is confirmed by a trend line or a trend channel.
6) If two levels are located too close to each other (from 5 to 15 points), then they should be considered as an area of support or resistance.
On the chart:
Support and Resistance Levels are the Levels that serve as targets when buying or selling the pair. You can place Take Profit near these levels.
Red lines are the channels or trend lines that display the current trend and show in which direction it is better to trade now.
The MACD indicator (14,22,3) consists of a histogram and a signal line. When they cross, this is a signal to enter the market. It is recommended to use this indicator in combination with trend lines (channels and trend lines).
Important speeches and reports (always contained in the news calendar) can greatly influence the movement of a currency pair. Therefore, during their exit, it is recommended to trade as carefully as possible or exit the market in order to avoid a sharp price reversal against the previous movement.
Beginners on Forex should remember that not every single trade has to be profitable. The development of a clear strategy and money management are the key to success in trading over a long period of time.


