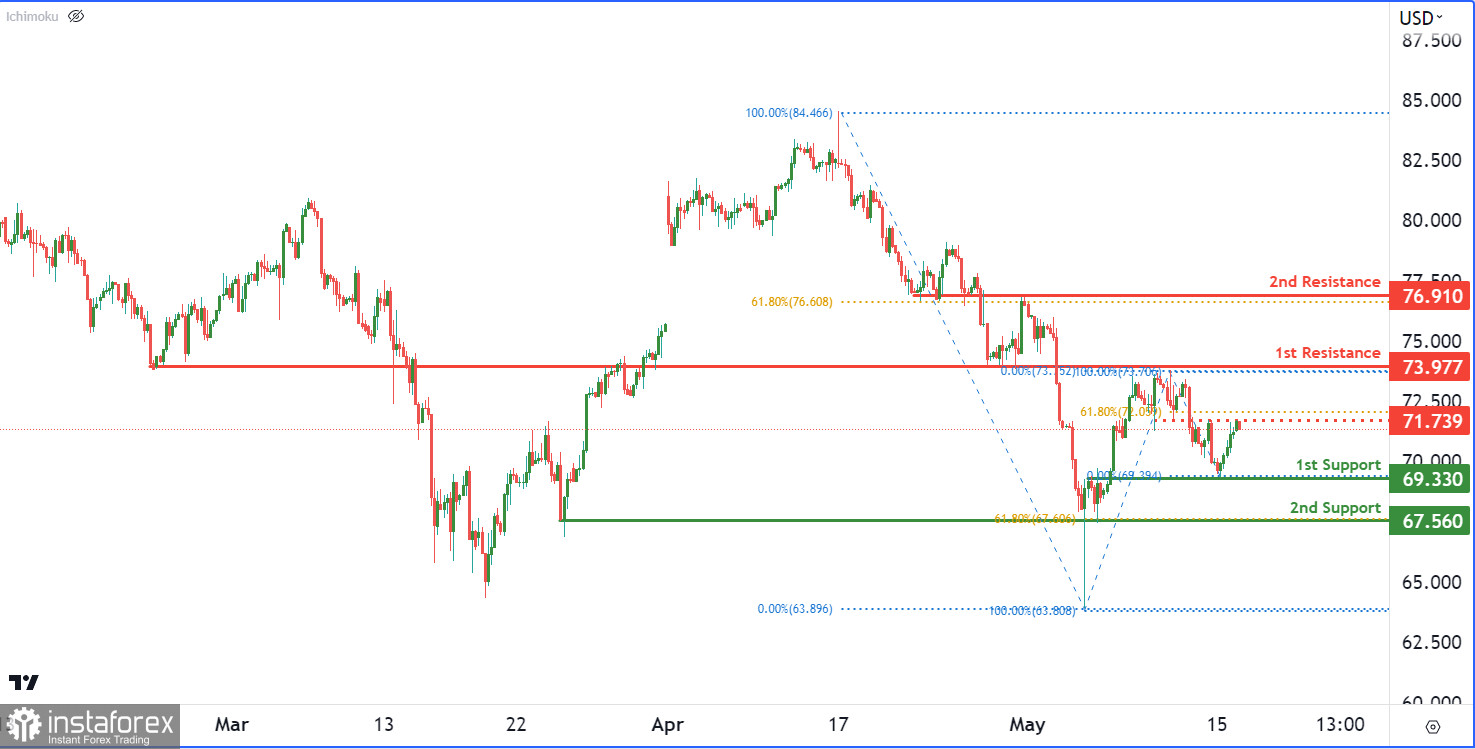
The West Texas Intermediate (WTI) Crude Oil chart is currently showing a bearish trend, with a potential movement towards the first support level at $69.33. If the price drops below this level, the next significant support is at $67.56. However, on the bullish side, resistance levels are found at $73.97 and $76.91, which align with Fibonacci retracement levels and could hinder price growth. Additionally, an intermediate resistance at $71.73 could pose a minor barrier to upward price movements.