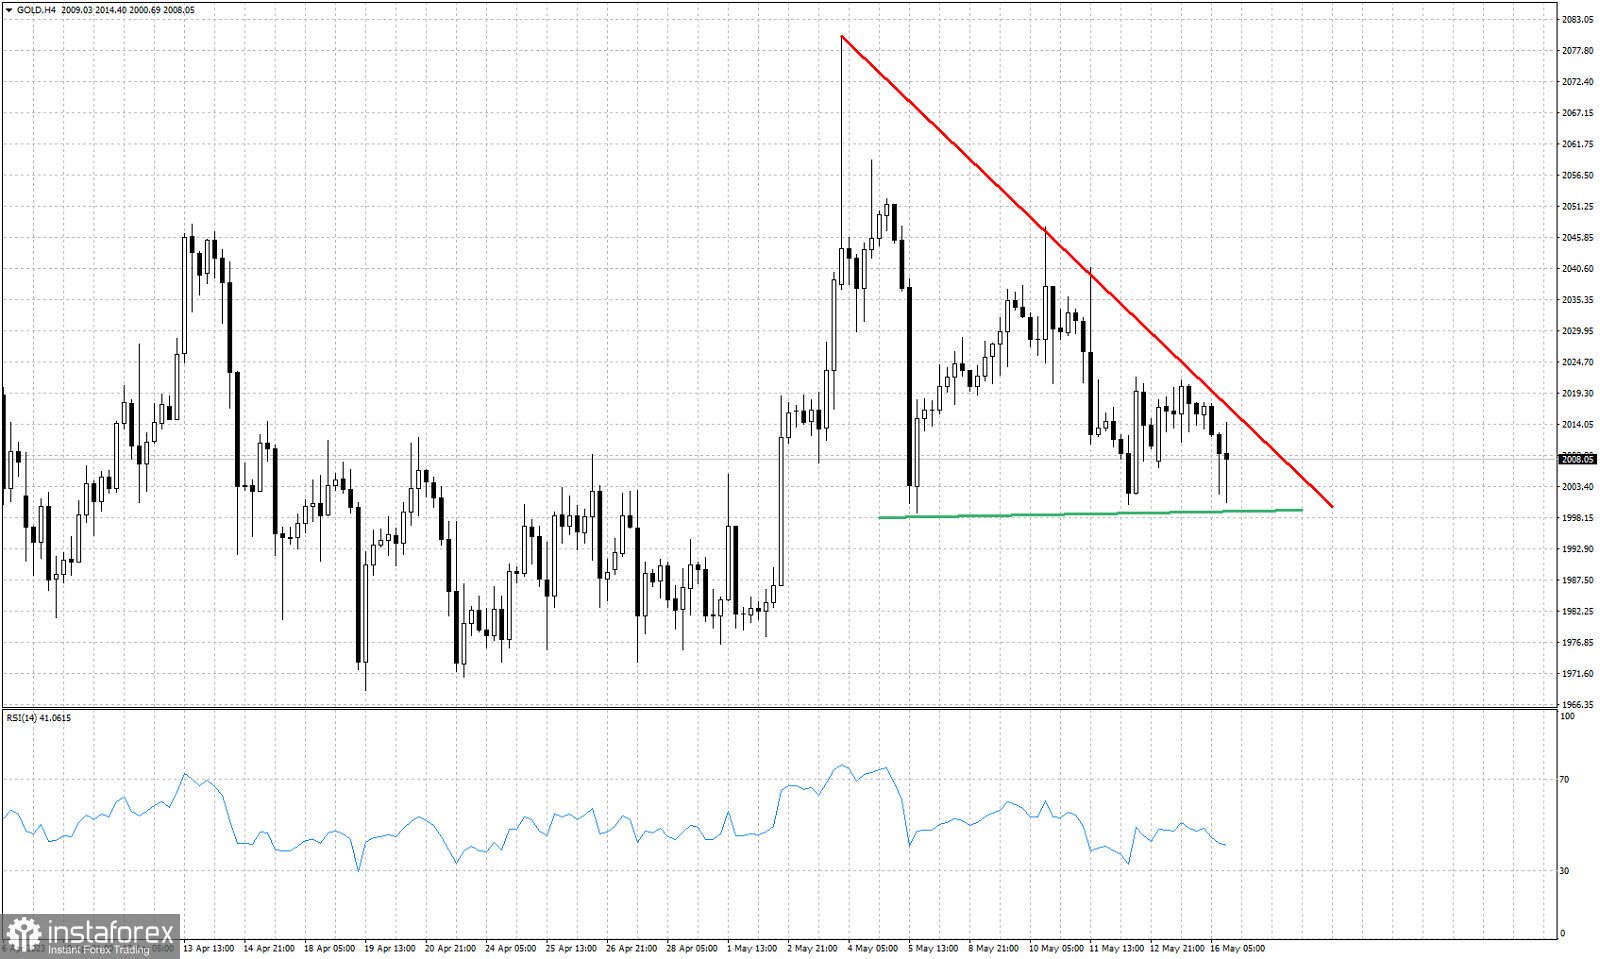
Red line- upper triangle boundary - resistance
Green line- support trend line
Gold price is trading around $2,008. Price has formed a triangle pattern in the near term with price so far respecting the triangle base support at $2,000. Price has been forming lower highs so far creating the upper triangle boundary. Resistance is now found at $2,014. So far support at $2,000 has been tested three times and all three it was respected. I do not expect to see a fourth test of the support trend line. This is a bearish descending triangle pattern and the lower highs suggest that bulls are weakening and each time price bounces, they are unable to surpass the previous high. Failure to hold $2,000 will open the way for a decline towards the next key support at $1,970-77.


