


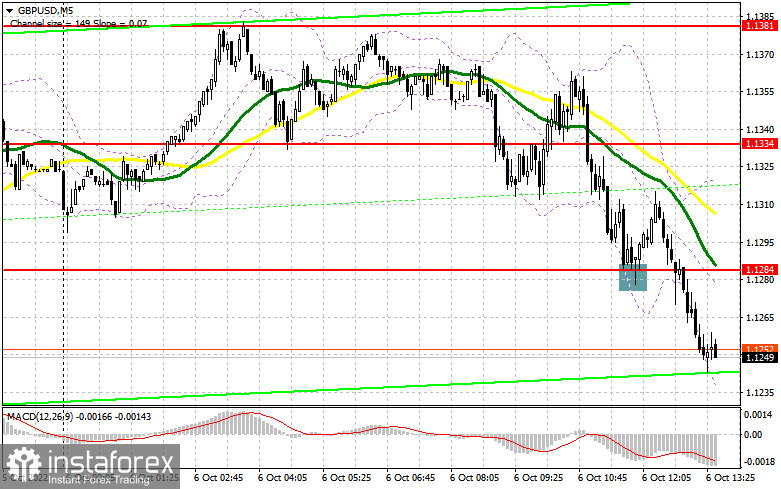
In the morning article, I turned your attention to the 1.1284 level and recommended making decisions with this level in focus. Now, let's look at the 5-minute chart and try to figure out what actually happened. A breakout of the nearest support level of 1.1334 took place without an upward test. Hence, there was no sell signal. After moving down to 1.1284, the bulls tried to protect this level. A buy signal appeared, which lead to a 30-pip rise. However, following the second attempt, the bears pushed the pair below 1.1284. The technical outlook was completely revised for the second half of the day.
Conditions for opening long positions on GBP/USD:
Further growth of the pound sterling is limited. For this reason, it is recommended to open long positions only if the price declines or there is a false breakout, similar to what I have discussed above. The economic calendar for the second half of the day is uneventful. The US is scheduled to release the initial Jobless Claims report. Fed policymakers Charles Evans and Lisa D. Cook are going to make speeches. They are likely to talk about the need to tame inflation. So, there will hardly be any new comments. In the evening, traders will be anticipating the publication of the Nonfarm Payrolls report, which is on tap on Friday. We will talk about this in detail tomorrow. If the pair takes a nosedive, the optimal scenario for opening long positions will be a false breakout of the support level of 1.1220. The pound sterling is now heading for this level. It will give an excellent buy signal with the prospect of a rise to 1.1296. At this level, the moving averages are moving in negative territory. Only after climbing above this level, an upward correction may occur. It could significantly weaken bearish momentum. The bears will not be able to push the pair to yesterday's low. The target level will be 1.1371 where it will become more difficult for buyers to control the market. A more distant target will be the 1.1430 level. If the price reaches this level, bears will have to leave the market. I recommend locking in profits there. If the GBP/USD falls following Fed officials' hawkish statements and bulls show no activity at1.1220, the pressure on the pound sterling will increase. In this case, it is better to cancel long positions until a false breakout of 1.1163 takes place. You can buy GBP/USD immediately at a bounce from 1.1095 or a low of 1.1018, keeping in mind an upward intraday correction of 30-35 pips.
Conditions for opening short positions on GBP/USD:
The main task of bears today is to protect the nearest resistance level of 1.1296, formed in the morning. As long as the bears control this level, there is a likelihood of a decrease to yesterday's low and a downward correction. A false breakout of 1.1296 will help bears regain the upper hand. It may also trigger a large downward correction to a low of 1.1220. A breakout and a downward test of this level will generate a sell signal with the prospect of a fall to 1.1163. The target level will be 1.1095 where I recommend locking in profits. If GBP/USD moves up and bears show no energy at 1.1296, bulls will again be in control. If so, the pair may jump to a high of 1.1371. Only a false breakout of this level will give a sell signal with the possibility of a downward correction. If bears fail the protect the target level, the price may rise to 1.1430. You can sell GBP/USD immediately at a bounce from this level, keeping in mind a downward intraday correction of 30-35 pips.
COT report
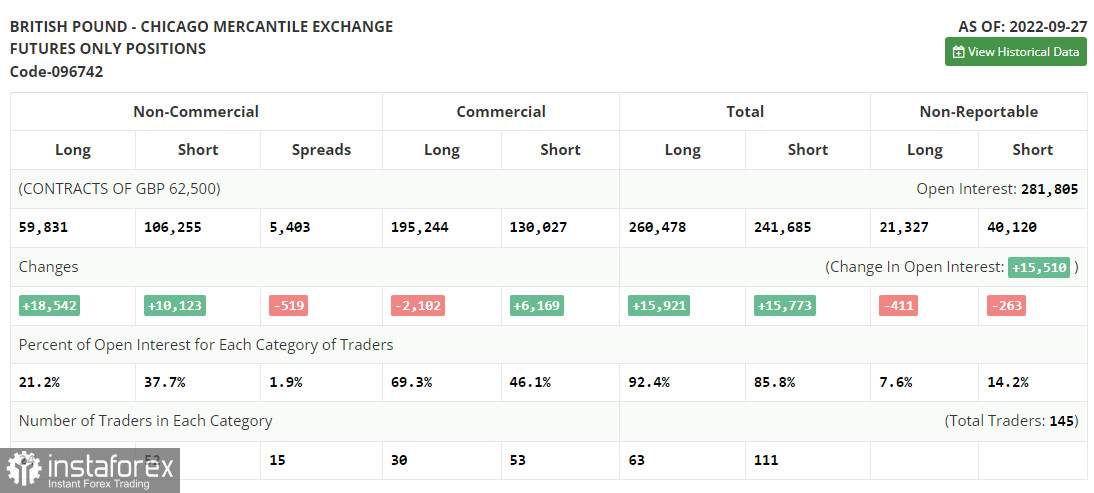
According to the COT report from September 27, the number of both long and short positions surged. Just in two days, the pound sterling lost about 10%. That is why the BoE had to intervene in the market to stabilize the situation. As a result, demand and the number of long positions increased. Notably, long positions increased more than short ones. After the BoE raised the benchmark rate just by 0.5%, the British pound tumbled to an all-time low against the US dollar, lacking just several pips to hit the parity level. However, the regulator's intervention in the bond market stabilized the currency market situation. This allowed bulls to recoup most of their losses. However, it is still unknown how long these actions will support the pound sterling. The fact is that the regulator is planning to raise the benchmark even more. This week, the UK will disclose data on business activity in various sectors. This may seriously affect the pound sterling and cap its upward potential. The recent COT report unveiled that the number of long non-commercial positions increased by 18,831 to 59,831, while the number of short non–commercial positions jumped by 10,123 to 106,255. This led to another small drop in the negative value of the non-commercial net position to the level of -46,424 versus -54,843. The weekly closing price collapsed from 1.0738 to 1.1392.
Signals of technical indicators
Moving averages
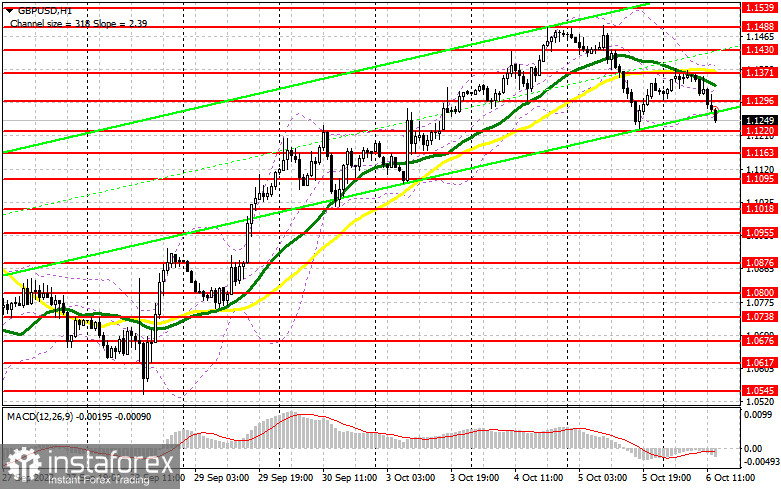
GBP/USD is trading below 30- and 50-period moving averages. It means that the bears don't give up attempts to regain the upper hand.
Remark. The author is analyzing the period and prices of moving averages on the 1-hour chart. So, it differs from the common definition of classic daily moving averages on the daily chart.
Bollinger Bands
If GBP/USD rises, the indicator's upper border at 1.1380 will act as resistance.
Definitions of technical indicators
- Moving average recognizes an ongoing trend through leveling out volatility and market noise. A 50-period moving average is plotted in yellow on the chart.
- Moving average identifies an ongoing trend through leveling out volatility and market noise. A 30-period moving average is displayed as the green line.
- MACD indicator represents a relationship between two moving averages that is a ratio of Moving Average Convergence/Divergence. The MACD is calculated by subtracting the 26-period Exponential Moving Average (EMA) from the 12-period EMA. A 9-day EMA of the MACD called the "signal line".
- Bollinger Bands is a momentum indicator. The upper and lower bands are typically 2 standard deviations +/- from a 20-day simple moving average.
- Non-commercial traders - speculators such as retail traders, hedge funds, and large institutions who use the futures market for speculative purposes and meet certain requirements.
- Non-commercial long positions represent the total long open position of non-commercial traders.
- Non-commercial short positions represent the total short open position of non-commercial traders.
- The overall non-commercial net position balance is the difference between the short and long positions of non-commercial traders.


