


Long-term perspective.
The EUR/USD currency pair has fallen by only 50 points during the current week. It would seem that nothing is terrible about this, but everything is much more complicated. In the middle of this week, the European currency gained a foothold above the critical line, which, we recall, is the first sign of a trend break. However, in the next three days, the downward movement resumed, and the price on Friday was already below the Kijun-sen line. Thus, once again, the emerging upward trend has remained unrealized. This time, by superhuman efforts, the euro adjusted against the global downward trend by 450 points, which is only 50 points more than it was adjusted in most cases. Therefore, we can say that the "minimum plan" has been fulfilled, and now we can move south again. Over the next week, the quotes may fall back to 20-year lows.
There were few macroeconomic events during the current week, but the pair traded trendily and volatile. The market had data on business activity at its disposal, which turned out to be quite weak in the European Union and the UK and very good in the USA. However, we recall that the business activity indices are not such important indicators that the pair "flew" after publication. The most important reports were released on Friday in the United States. However, they did not have much significance for the technical picture, and Friday's volatility turned out to be the weakest. Much more importantly, the geopolitical situation continues to escalate and worsen. Relations between the West and the Russian Federation are completely spoiled. The explosion of the Nord Stream stopped almost all gas supplies to Europe. The European Union, meanwhile, is establishing "gas relations" with other countries. In Ukraine, too, there is "no smell" of the end of the geopolitical conflict. Today it became known about the explosion on the Crimean bridge.
COT analysis.
COT reports on the euro currency in 2022 can be entered in the textbook as an example. For half of the year, they showed a frank "bullish" mood of professional players, but at the same time, the European currency was steadily falling. Then they showed a "bearish" mood for several months, and the euro currency also fell steadily. The net position of non-profit traders is bullish again, and the euro continues to fall. This is happening, as we have already said, because the demand for the US dollar remains very high against the backdrop of a difficult geopolitical situation. Therefore, even if the demand for the euro currency is growing, the high demand for the dollar does not allow the euro currency itself to grow. During the reporting week, the number of buy-contracts from the non-commercial group decreased by 9.3 thousand, and the number of shorts – by 19.2 thousand. Accordingly, the net position increased by about 9.9 thousand contracts. This fact does not matter much since the euro remains "at the bottom" anyway. Professional traders still prefer the euro to the dollar at this time. The number of buy contracts is 45 thousand higher than the number of sell contracts for non-commercial traders, but the European currency cannot extract any dividends from this. Thus, the net position of the "non-commercial" group can continue to grow, but it does not change anything. Even if you pay attention to the total number of buy and sell positions, their values are approximately the same, but the euro still falls. Thus, we need to wait for changes in the geopolitical and fundamental background for something to change in the foreign exchange market.
Analysis of fundamental events.
This week, all the most important statistics were released on Friday. One can, of course, recall the ISM indices in the USA, but their values were not so resonant as to expect them to influence the pair's movement strongly. But on Friday, traders were in for a real surprise. A month earlier, the unemployment rate in the US rose by 0.2% to 3.7%, and many expected that this indicator would now grow. But by the end of September, unemployment fell back to 3.5% and remained at the lowest value in 50 years. The number of non-farms created in September amounted to 263 thousand, corresponding to forecasts. Thus, the conclusion is unequivocal: the US labor market is not experiencing any problems, which means the Fed can continue to raise the rate at a high pace, which is favorable for the dollar. We expect 2-3 more rate increases, which will take about five months. Consequently, the US currency can grow calmly for another 2-3 months.
Trading plan for the week of October 10th – 14th:
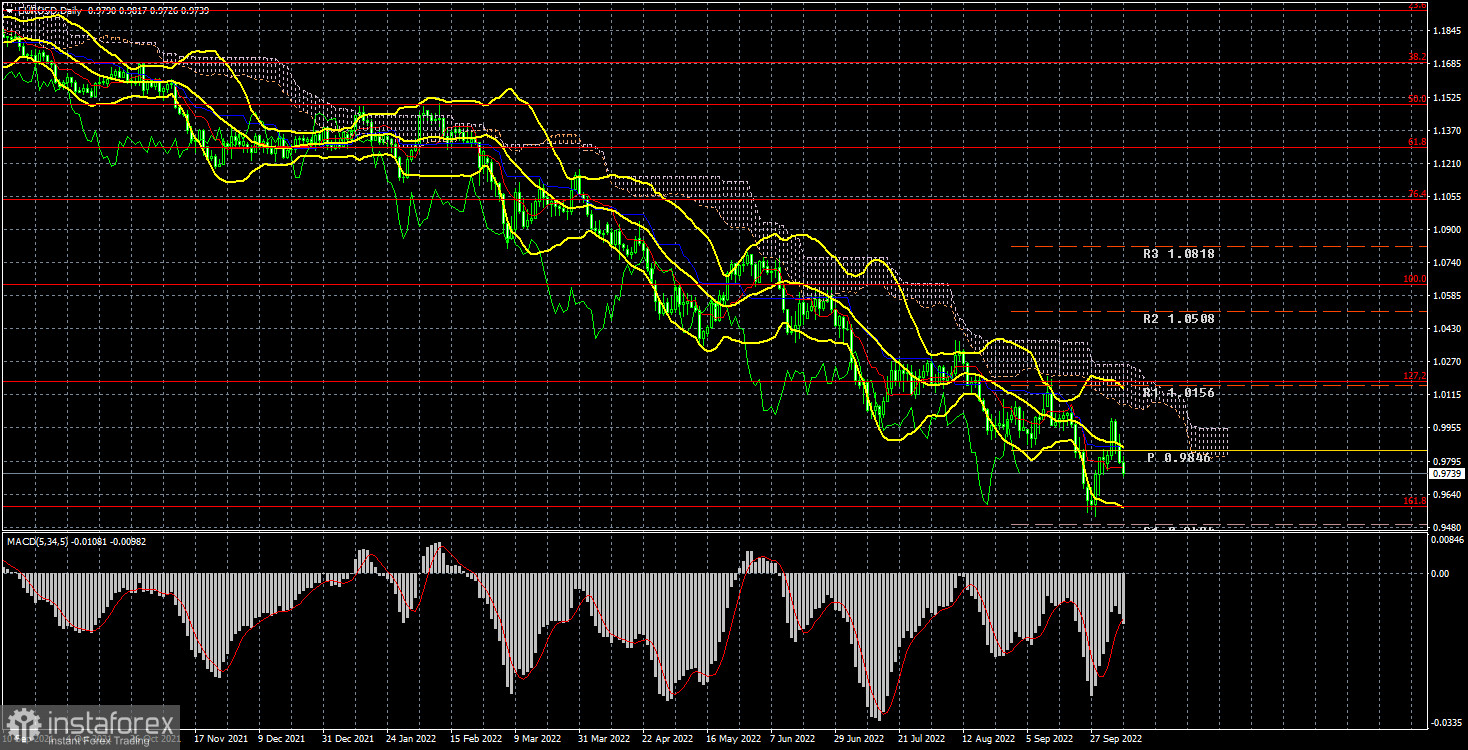
1) In the 24-hour timeframe, the pair resumed their movement to the south. Almost all factors still support the long-term growth of the US dollar, although euro support factors are slowly beginning to appear. The price is below the Ichimoku cloud and the critical line, so purchases are not relevant now. To do this, you must wait at least for consolidation above the Senkou Span B line and only consider long positions.
2) The sales of the euro/dollar pair are still more relevant now. The price is again below the critical line, so we expect a resumption of the fall with a target below the level of 0.9582 (161.8% Fibonacci). In the future, if the fundamental background for the euro currency does not improve and geopolitics continues to deteriorate, the euro currency may fall even lower.
Explanations of the illustrations:
Price levels of support and resistance (resistance/support), Fibonacci levels – targets when opening purchases or sales. Take Profit levels can be placed near them.
Ichimoku indicators (standard settings), Bollinger Bands (standard settings), MACD (5, 34, 5).
Indicator 1 on the COT charts is the net position size of each category of traders.
Indicator 2 on the COT charts is the net position size for the "Non-commercial" group.


