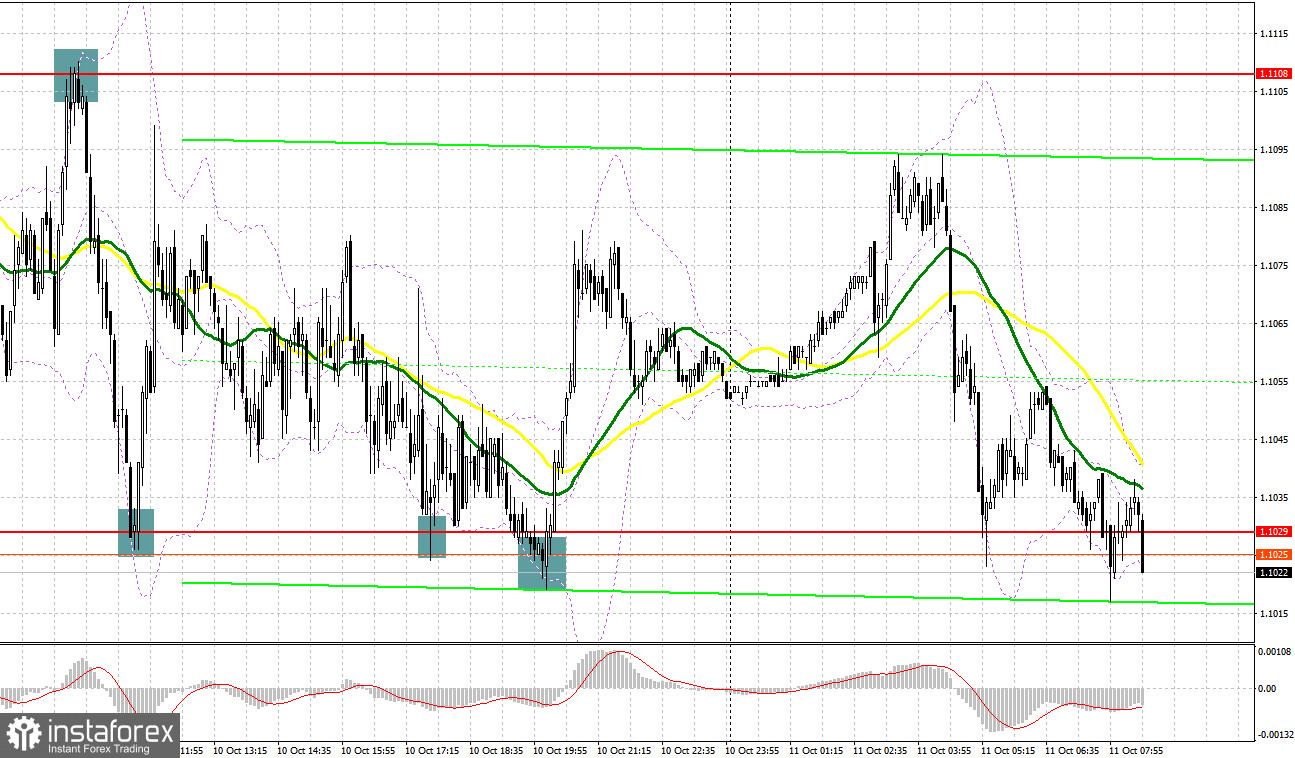
Quite a lot of excellent market entry signals were formed yesterday. Let's take a look at the 5-minute chart and figure out what happened. I paid attention to levels 1.1108 and 1.1029 in my morning forecast and advised making decisions on entering the market there. An unsuccessful attempt by bulls on the pound to go above 1.1108 led to a false breakout and a sell signal, as a result of which the pair collapsed to the 1.1029 area, allowing more than 70 points of profit to be taken. However, the bulls did not sit on the sidelines and defending 1.1029 gave a false breakout and a buy signal there. The pair recovered by more than 70 points. In the afternoon, despite the pound being under pressure, the bulls continued to actively defend 1.1029, creating several good entry points to buy from this level, which resulted in a move up by more than 50 points.

COT report:
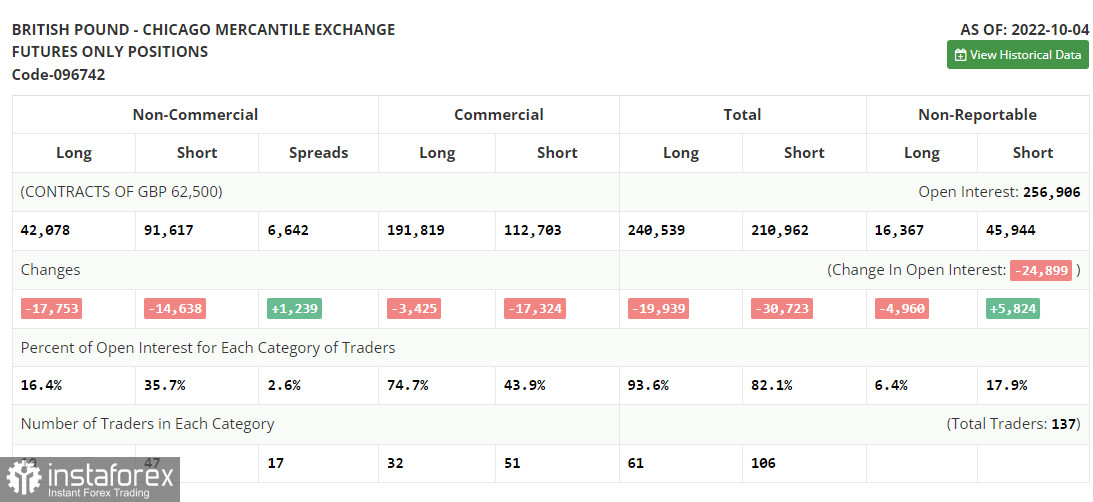
Before analyzing the technical picture of the pound, let's look at what happened in the futures market. The Commitment of Traders (COT) report for October 4 logged a sharp decline in both long and short positions. The report has already recorded the fact that the pound fell by more than 10% in two days, and then its sharp recovery amid the Bank of England's intervention. Now, when the situation has stabilized a bit, it is clear that those who want to buy and sell the pound have significantly decreased. Given that the prospects for the British economy are deteriorating sharply and it is far from clear how the government is going to continue to deal with the cost-of-living crisis and high inflation - let me remind you that the last tax reduction plan failed; it is unlikely to expect further recovery of the pound. Activity in the UK private sector and in the service sector continues to decline, which also does not add confidence to investors. Much will depend on the Federal Reserve's policy, which is directly related to the US inflation report expected this week. For this reason, I do not bet on further growth of the pound in the current conditions and prefer the US dollar. The latest COT report indicates that long non-commercial positions decreased by 17,753, to the level of 42,078, while short non-commercial positions decreased by 14,638, to the level of 91,617, which led to a slight reduction in the negative value of the non-commercial net position to -49,539, against -46,424. The weekly closing price recovered and it was 1.1494 against 1.0738.

When to go long on GBP/USD:
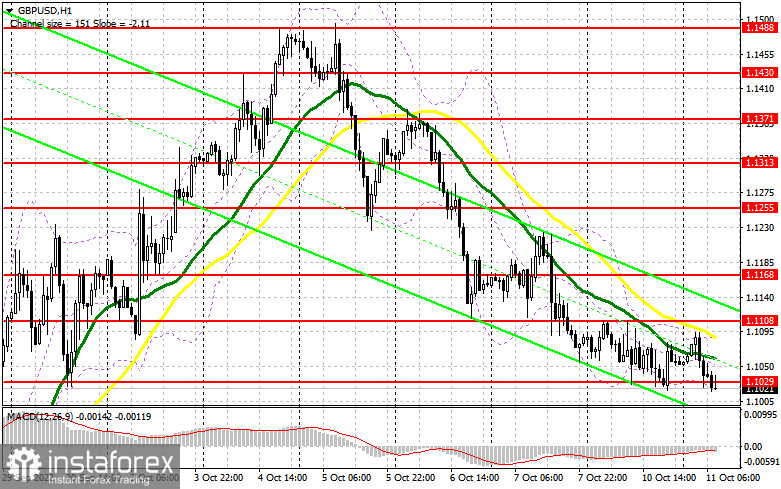
Today there is a large series of data on the UK, which may have a negative impact on the pair and cause it to leave the horizontal channel - and most likely it will move downward. Retail sales are expected, but more importantly, how the labor market is feeling right now: the reduction in the average wage and the increase in the number of applications for unemployment benefits in the UK will hit the positions of the pound bulls. For this reason, it is so important for the bulls to keep the pound within the channel after the reports are released, as it was in it all day on Monday. In case GBP/USD falls, the optimal buying scenario would be forming a false breakout around 1.1029, similar to what I discussed above. This will provide a great entry point with the goal to return to 1.1098. We can only talk about building an upward correction for the pair if it goes above this range. A breakthrough of 1.1098, as well as a reverse downward test will open the way to 1.1168, where it will become more difficult for bulls to control the market. A more distant target will be the area of 1.1255, which will lead to a fairly large capitulation of the bears - I recommend taking profit there.
If GBP/USD falls and there are no bulls at 1.1029, which is more likely, the pound will be under pressure again. If this happens, I recommend postponing long positions to 1.0955. I advise you to buy there only on a false breakout. You can open longs on GBP/USD immediately for a rebound from 1.0876, or in the low area of 1.0800 with the goal of correcting 30-35 points within the day.
When to go short on GBP/USD:
There are fewer and fewer reasons to buy the British pound. Yesterday there were rumors that in the near future the BoE will again be forced to intervene in the situation on the bond market, as the recent effect of its actions is gradually "fading". This only adds to the nervousness of investors. Against this background, protecting the nearest resistance at 1.1098, formed on the basis of last week, is an important task. Bears should not release the pair outside this range, as this will provoke new longs, allowing the bulls to regain their position in the market. In case GBP/USD grows, forming a false breakout at 1.1098 creates pressure on the pound and a signal to sell, counting on the return of the bearish trend and a decrease to the nearest support at 1.1029. A breakthrough and reverse test from the bottom up of this range on the back of weak reports on the state of the UK labor market will provide an entry point for shorts already with an updated low of 1.0955. A more distant target will be the area of 1.0876, where I recommend taking profits.
In case GBP/USD grows and the bears are not active at 1.1098, the bulls will regain control of the situation, albeit only for a while, which will lead to an increase in GBP/USD to the 1.1168 area. A false breakout at this level forms an entry point into short positions, counting on a new downward movement of the pair. If traders are not active there, there may be a surge up to the high of 1.1255. There, I advise you to sell GBP/USD immediately for a rebound, based on a rebound of the pair down by 30-35 points within the day.

Indicator signals:
Trading is below 30 and 50 moving averages, which indicates a further fall in the pound.
Moving averages
Note: The period and prices of moving averages are considered by the author on the H1 hourly chart and differs from the general definition of the classic daily moving averages on the daily D1 chart.
Bollinger Bands
A breakthrough of the indicator's upper border around 1.1098 will lead to a new wave of growth for the pound.
Description of indicators
- Moving average (moving average, determines the current trend by smoothing out volatility and noise). Period 50. It is marked in yellow on the chart.
- Moving average (moving average, determines the current trend by smoothing out volatility and noise). Period 30. It is marked in green on the chart.
- MACD indicator (Moving Average Convergence/Divergence — convergence/divergence of moving averages) Quick EMA period 12. Slow EMA period to 26. SMA period 9
- Bollinger Bands (Bollinger Bands). Period 20
- Non-commercial speculative traders, such as individual traders, hedge funds, and large institutions that use the futures market for speculative purposes and meet certain requirements.
- Long non-commercial positions represent the total long open position of non-commercial traders.
- Short non-commercial positions represent the total short open position of non-commercial traders.
- Total non-commercial net position is the difference between short and long positions of non-commercial traders.


