


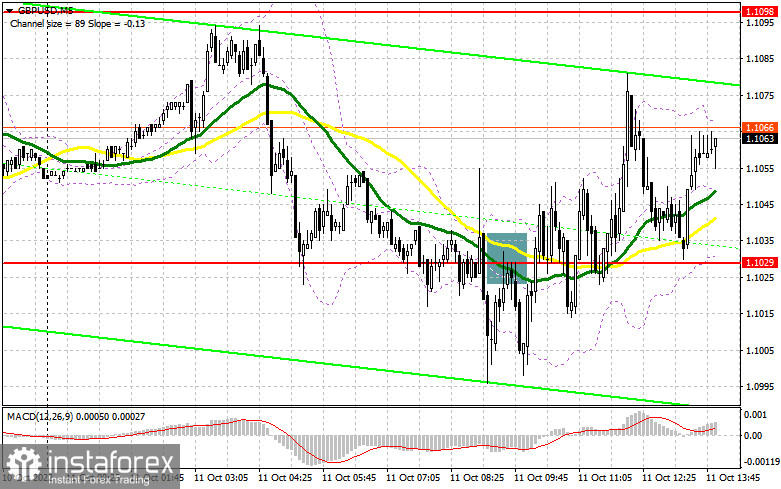
In my morning forecast, I paid attention to the 1.1029 level and recommended deciding on entering the market there. Let's look at the 5-minute chart and figure out what happened. The sharp increase in the number of applications for unemployment benefits in the UK, together with a decrease in the unemployment rate itself, can be explained by the fact that data is provided for different periods. However, this still resulted in a fall in the pound and a breakthrough of 1.1029. A reverse test of this level led to a sell signal, but after a repeated downward movement of 30 points, the pressure on the pair decreased, leading to recovery and a return to 1.1029. In the afternoon, the technical picture underwent some changes.
To open long positions on GBP/USD, you need:
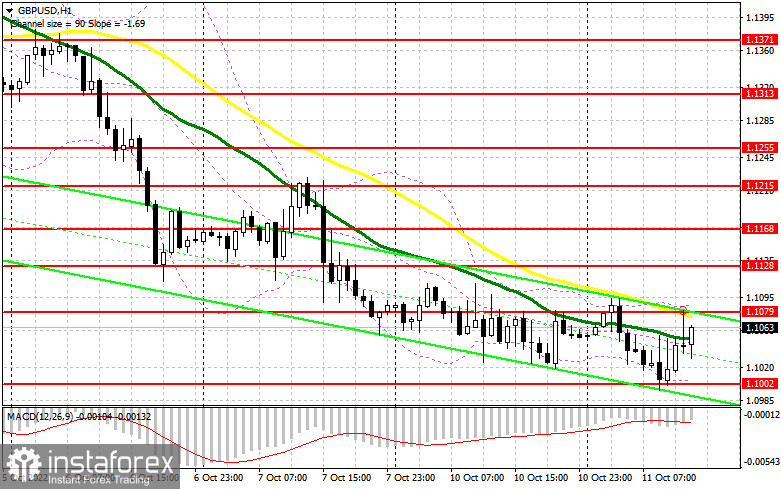
During the American session, nothing could seriously affect the pound's direction, so I recommend continuing trading in the channel. The NFIB's small business optimism indicator is unlikely to help the dollar much, as are the statements of FOMC member Loretta Mester, who will repeat everything her colleagues said earlier. Markets are taking a break before the final US inflation data, so don't be surprised if the pound's volatility drops slightly. If the pair moves down in the afternoon, the optimal scenario for buying will be the formation of a false breakdown in the support area of 1.1002. This will give an excellent entry point to return to the level of 1.1079, just above which the moving averages are passing, which now limits the further upward potential of the pair. Only after getting above this range will it be possible to talk about building an upward correction and a partial defeat of sellers. The target of the movement will be the area of 1.1128. But the resistance of 1.1168 will be much more interesting, the update of which will lead to a fairly large capitulation of sellers. I recommend fixing profits there. If the GBP/USD falls against the background of hawkish statements by representatives of the Federal Reserve System and the absence of buyers at 1.1002, the pressure on the pound will increase. In this case, I recommend postponing long positions to 1.0935. I advise you to buy there only on a false breakdown. It is possible to open long positions on GBP/USD immediately for a rebound from 1.0876, or around the minimum of 1.0800, with the aim of a correction of 30-35 points within a day.
To open short positions on GBP/USD, you need:
The bears updated the weekly minimum but failed to stay there. However, they once again proved a downward trend in the pair, so the observed upward correction can be a good reason to sell the pound at attractive prices. Of course, the optimal scenario for selling will be a false breakdown in the resistance area of 1.1079, the test of which may occur after American politicians' speeches. However, a more important task is to take control of the 1.1002 level. A breakout and a reverse test from the bottom up of this range will return pressure on the pair and give a chance for a larger drop with a breakdown of the 1.0935 minimum. Going beyond this range will determine the entry point for sale with a fall to 1.0876, but a much more interesting target will be the 1.0800 area, where I recommend fixing the profits. But such a large movement will be possible only in the middle of the week when the US inflation report will be released. If there are no buyers at 1.1079, which also cannot be excluded - after all, it is necessary to follow the sellers' stop orders before important reports-I recommend postponing sales until 1.128. Only a false breakout at this level forms an entry point into short positions based on the pound's movement down. If there is a lack of activity, there may be a jerk up to 1.1168, where I advise you to sell GBP/USD immediately for a rebound, counting on a correction down by 30-35 points within a day.
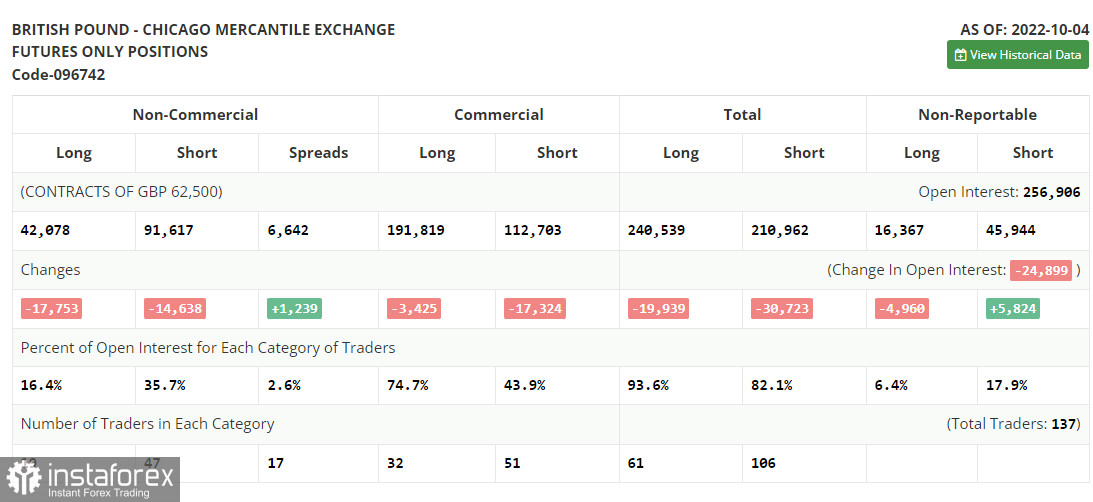
The COT report (Commitment of Traders) for October 4 recorded a sharp reduction in both long and short positions. The report has already recorded that the pound fell by more than 10% in two days and then made a sharp recovery against the background of the intervention of the Bank of England. Now that the situation has stabilized, it is clear that those who want to buy and sell the pound have sharply decreased. Activity in the UK private sector and the service sector continues to decline, which also does not add confidence to investors. A lot will depend on the Fed's policy, which is directly related to the US inflation report expected this week.
For this reason, I do not bet on further growth of the pound in the current conditions and prefer the US dollar. The latest COT report indicates that long non-commercial positions decreased by 17,753 to 42,078. In contrast, short non-commercial positions decreased by 14,638 to 91,617, which led to a slight reduction in the negative value of the non-commercial net position to -49,539, against -46,424. The weekly closing price recovered, and it was 1.1494 against 1.0738.
Signals of indicators:
Moving Averages
Trading is conducted below the 30 and 50-day moving averages, which indicates an attempt to decrease the pound further.
Note: The author considers the period and prices of moving averages on the hourly chart H1 and differ from the general definition of the classic daily moving averages on the daily chart D1.
Bollinger Bands
In the case of growth, the upper limit of the indicator around 1.1079 will act as resistance.
Description of indicators
- Moving average (moving average determines the current trend by smoothing out volatility and noise). Period 50. The graph is marked in yellow.
- Moving average (moving average determines the current trend by smoothing out volatility and noise). Period 30. The graph is marked in green.
- MACD indicator (Moving Average Convergence / Divergence - moving average convergence/divergence) Fast EMA period 12. Slow EMA period 26. SMA period 9
- Bollinger Bands (Bollinger Bands). Period 20
- Non-profit speculative traders, such as individual traders, hedge funds, and large institutions use the futures market for speculative purposes and to meet certain requirements.
- Long non-commercial positions represent the total long open position of non-commercial traders.
- Short non-commercial positions represent the total short open position of non-commercial traders.
- Total non-commercial net position is the difference between the short and long positions of non-commercial traders.


