


Analysis of Wednesday's deals:
30M chart of the EUR/USD pair
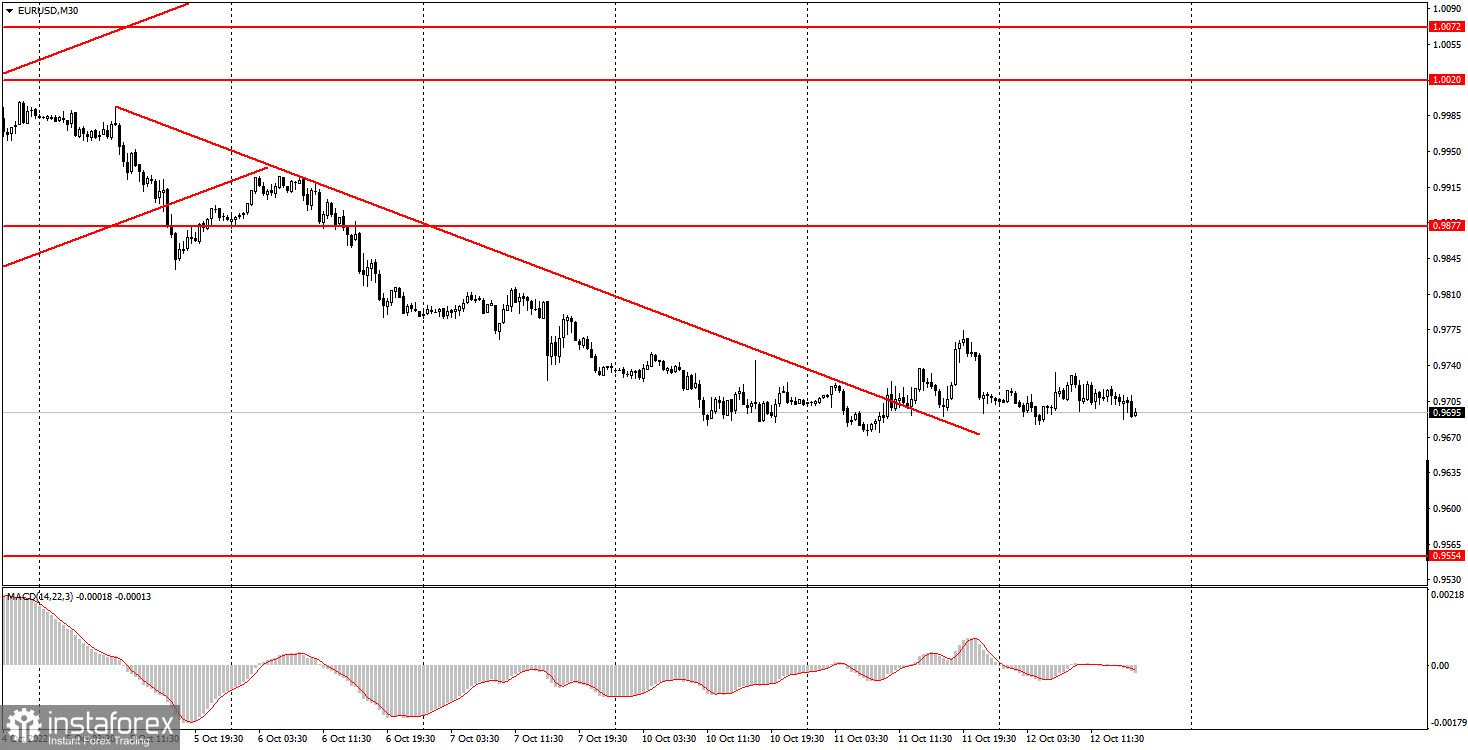
The EUR/USD currency pair continued to trade in absolute flat on Wednesday. Thus, there is absolutely nothing to add on the technical picture now. The pair is moving sideways after the price has broken the downtrend line, however, we remember that the signals formed in the flat are very weak. The euro continues to be very close to its 20-year lows, so we continue to believe that the single currency will continue to fall, given the current geopolitical and fundamental background. Only one important report has been published on Wednesday. Relatively important. A report on industrial production was published in the European Union, which showed an increase of 1.5% in monthly terms. This value turned out to be higher than expected, but the market did not react to it in any way, which is clearly visible on any chart. European Central Bank President Christine Lagarde will deliver a speech, but we don't have high hopes for it either. It is unlikely that Lagarde's rhetoric will undergo major changes. Thus, most likely, at least until Thursday's release of the US inflation report, the flat will remain.
5M chart of the EUR/USD pair
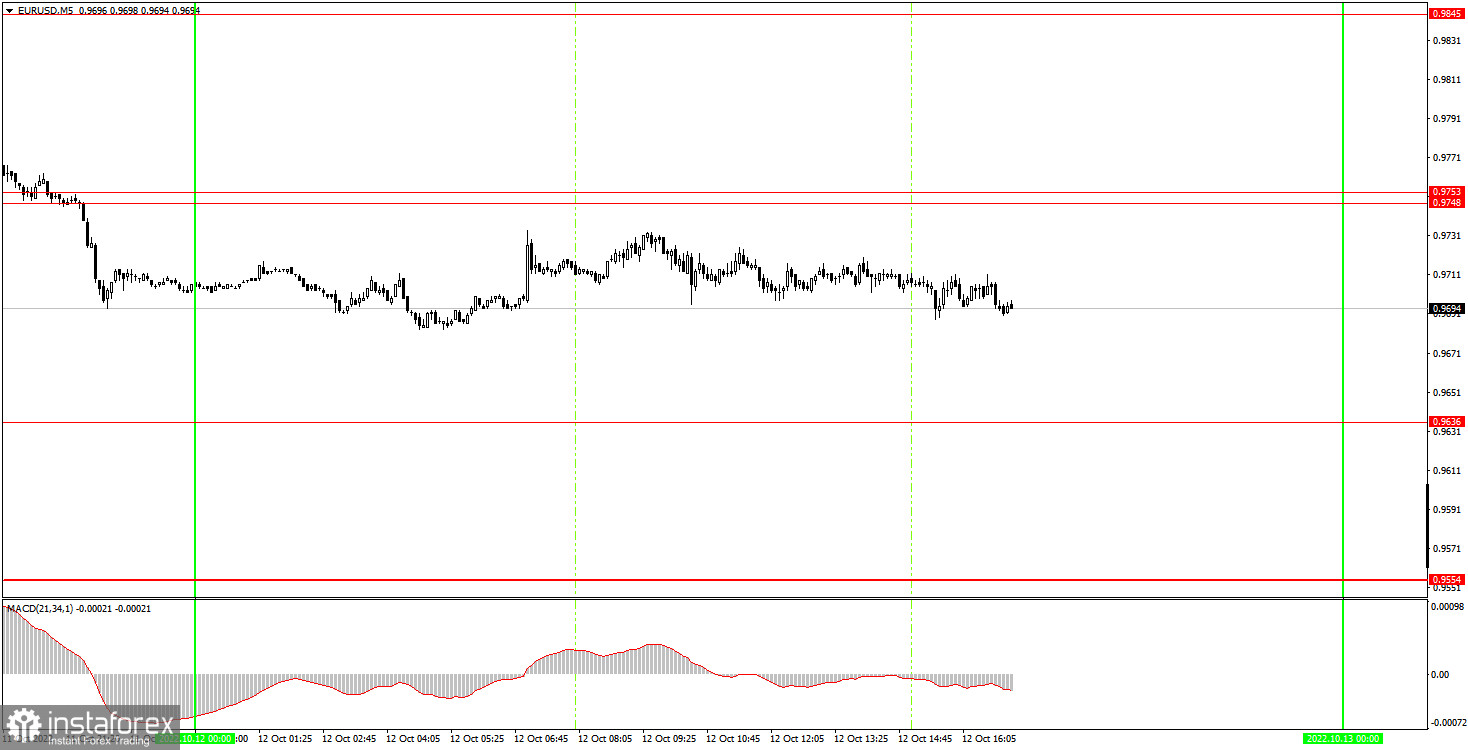
No trading signals were formed on the 5-minute timeframe, because the pair never approached any of the levels all day. In principle, we believe that this is good, since a blatant flat was observed all day and the signals could be false. Therefore, novice players should not have entered the market on Wednesday. In general, they should expect a more favorable situation for entering the market than an absolute flat.
How to trade on Thursday:
The pair maintains a downward trend on the 30-minute timeframe but at the same time it is trading in an absolute flat. It is most inconvenient to trade now, and there are practically no signals. We believe that the pair may resume its downward movement and renew its 20-year lows in the near future. The euro once again shows its unpreparedness for serious growth. On the 5-minute TF on Thursday it is recommended to trade at the levels of 0.9554, 0.9636, 0.9748-0.9753, 0.9845, 0.9877, 0.9952. When passing 15 points in the right direction, you should set Stop Loss to breakeven. No important events planned in the European Union on Thursday, and the key inflation report of the week will be released in the US. The market's reaction to it may be different, everything will depend on what the value of this report will be. A weak fall in inflation or its absence may provoke an increase in the US dollar.
Basic rules of the trading system:
1) The signal strength is calculated by the time it took to form the signal (bounce or overcome the level). The less time it took, the stronger the signal.
2) If two or more deals were opened near a certain level based on false signals (which did not trigger Take Profit or the nearest target level), then all subsequent signals from this level should be ignored.
3) In a flat, any pair can form a lot of false signals or not form them at all. But in any case, at the first signs of a flat, it is better to stop trading.
4) Trade deals are opened in the time period between the beginning of the European session and until the middle of the US one, when all deals must be closed manually.
5) On the 30-minute TF, using signals from the MACD indicator, you can trade only if there is good volatility and a trend, which is confirmed by a trend line or a trend channel.
6) If two levels are located too close to each other (from 5 to 15 points), then they should be considered as an area of support or resistance.
On the chart:
Support and Resistance Levels are the Levels that serve as targets when buying or selling the pair. You can place Take Profit near these levels.
Red lines are the channels or trend lines that display the current trend and show in which direction it is better to trade now.
The MACD indicator (14,22,3) consists of a histogram and a signal line. When they cross, this is a signal to enter the market. It is recommended to use this indicator in combination with trend lines (channels and trend lines).
Important speeches and reports (always contained in the news calendar) can greatly influence the movement of a currency pair. Therefore, during their exit, it is recommended to trade as carefully as possible or exit the market in order to avoid a sharp price reversal against the previous movement.
Beginners on Forex should remember that not every single trade has to be profitable. The development of a clear strategy and money management are the key to success in trading over a long period of time.


