


Analysis of Wednesday's deals:
30M chart of the GBP/USD pair
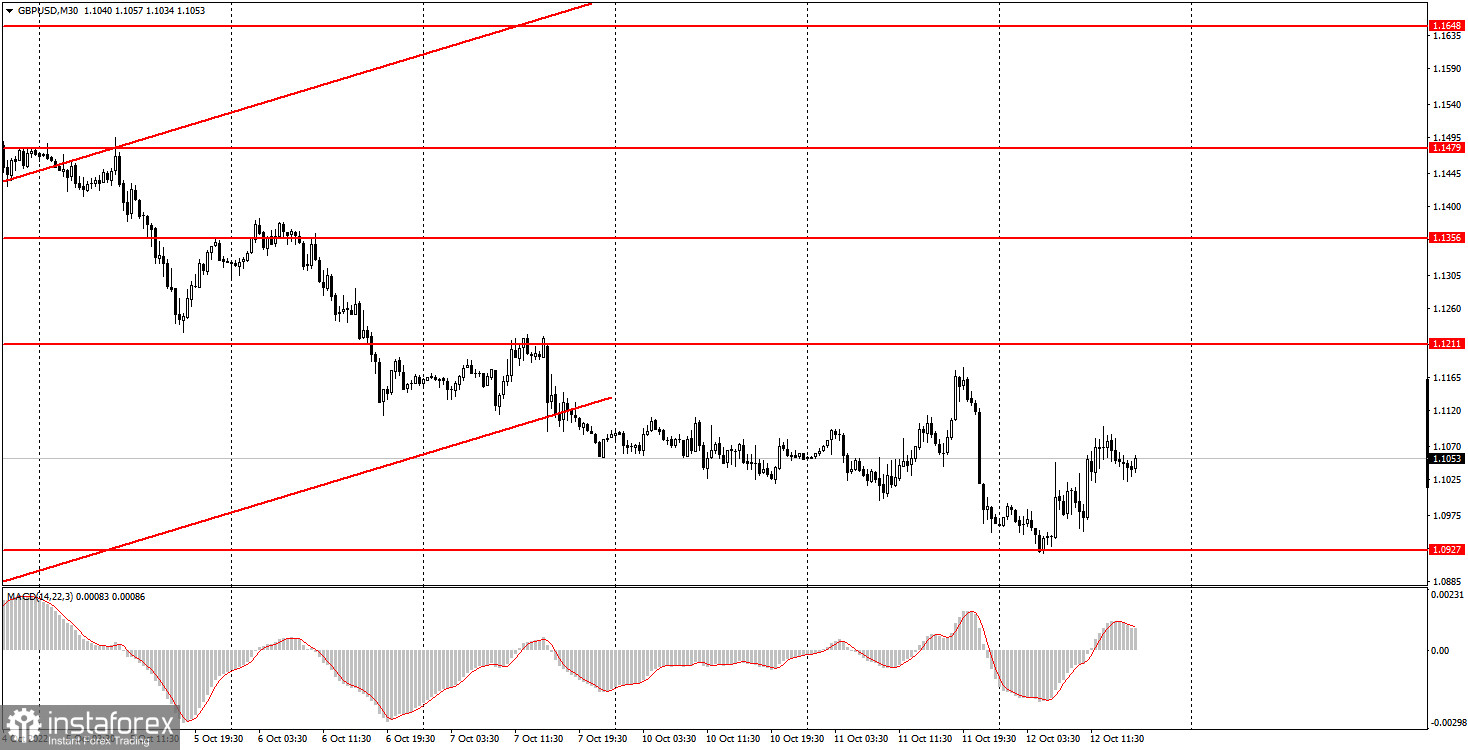
The GBP/USD pair traded quite actively on Tuesday evening and Wednesday again. For example, after writing and publishing our article, quotes soared up sharply, and then fell even more rapidly in just a few hours. The total volatility of the day was 230 points. On Wednesday, the pair rebounded perfectly from the level of 1.0927 in perfect accuracy and started a new round of correction, which does not affect the current downward trend in any way, which has become more pronounced after the price settles below the rising channel. Thus, the pound is in the same downward movement as the euro. There is a difference in the movement of both pairs, but they are not so striking as to be noted. The UK published data on industrial production and GDP. The GDP report was monthly, so it did not make a strong impression on traders. According to the results of August, the indicator decreased by 0.3%, although forecasts spoke of an increase of 0-0.1%. In annual terms, the increase was 2% in August, while the forecast was 2.1-2.4%. Industrial production decreased by 1.8% m/m and by 5.2% y/y. Naturally, the forecasts here were much better. Therefore, the pound's growth on Wednesday, at least, is illogical and unjustified. So it was purely technical, due to a rebound from the level of 1.0927.
5M chart of the GBP/USD pair
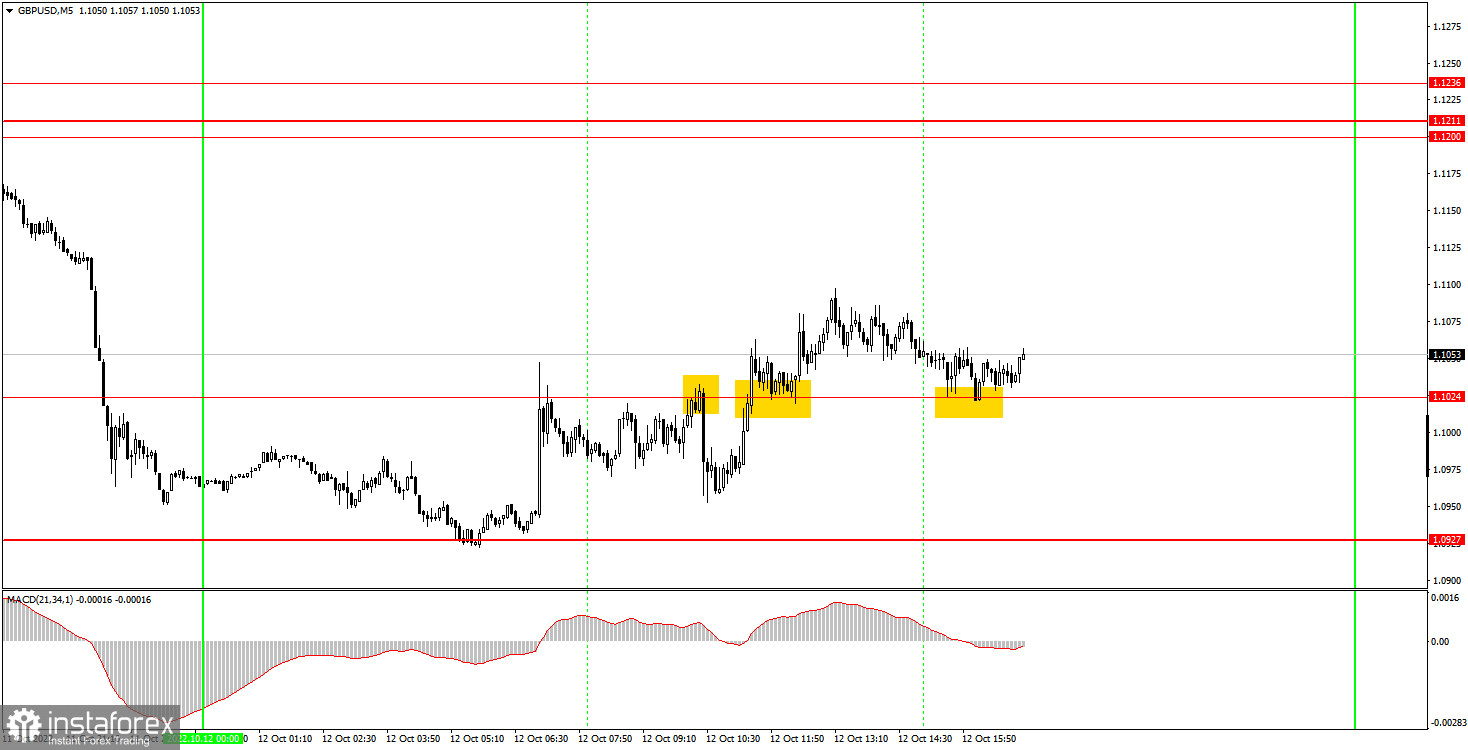
Despite a very beautiful trading signal on the hourly timeframe, there were no good signals on the 5-minute timeframe on Wednesday. That notorious rebound from the level of 1.0927 occurred at night, and novice traders clearly could not work it out. Also during the night there was a rebound from the level of 1.1024. But with the opening of the European trading session, the price once rebounded from the level of 1.1024 from below, once overcame it and once rebounded from it above. That is, all the signals of the day formed around the same level, which is a sign of a flat. Of course, there was no flat, but the signals were not the best. The first signal should not have been worked out at all, since at the time of its formation the price had already gone down by one candle for 50 points. The second buy signal turned out to be false, but the pair was able to go up 45 points, so beginners had to set Stop Loss to breakeven, at which the position was closed. The last third signal made it possible to earn literally 10-20 points, and it had to be closed manually in the late afternoon.
How to trade on Thursday:
On the 30-minute timeframe, the GBP/USD pair is leaning more and more every day to resume the long-term downward trend. So far, it has not managed to overcome the level of 1.0927, but this does not mean that it will not succeed in the future. The pound is still in big trouble with the factors supporting it. They are either very few or non-existent. On the 5-minute TF on Thursday it is recommended to trade at the levels of 1.0833, 1.0927, 1.1024, 1.1200-1.1211-1.1236, 1.1356. When the price passes after opening a position in the right direction for 20 points, Stop Loss should be set to breakeven. No interesting and important reports planned for Thursday in Great Britain, and in the US there will be an inflation report, which is the main event of the week. We believe that there will be a reaction to this report if the actual value and the forecast do not match.
Basic rules of the trading system:
1) The signal strength is calculated by the time it took to form the signal (bounce or overcome the level). The less time it took, the stronger the signal.
2) If two or more deals were opened near a certain level based on false signals (which did not trigger Take Profit or the nearest target level), then all subsequent signals from this level should be ignored.
3) In a flat, any pair can form a lot of false signals or not form them at all. But in any case, at the first signs of a flat, it is better to stop trading.
4) Trade deals are opened in the time period between the beginning of the European session and until the middle of the US one, when all deals must be closed manually.
5) On the 30-minute TF, using signals from the MACD indicator, you can trade only if there is good volatility and a trend, which is confirmed by a trend line or a trend channel.
6) If two levels are located too close to each other (from 5 to 15 points), then they should be considered as an area of support or resistance.
On the chart:
Support and Resistance Levels are the Levels that serve as targets when buying or selling the pair. You can place Take Profit near these levels.
Red lines are the channels or trend lines that display the current trend and show in which direction it is better to trade now.
The MACD indicator (14,22,3) consists of a histogram and a signal line. When they cross, this is a signal to enter the market. It is recommended to use this indicator in combination with trend lines (channels and trend lines).
Important speeches and reports (always contained in the news calendar) can greatly influence the movement of a currency pair. Therefore, during their exit, it is recommended to trade as carefully as possible or exit the market in order to avoid a sharp price reversal against the previous movement.
Beginners on Forex should remember that not every single trade has to be profitable. The development of a clear strategy and money management are the key to success in trading over a long period of time.


