


Details of the economic calendar for October 12
The volume of industrial production in the UK has lost the pace of recovery. Based on the data received, the industry in Britain fell by 1.6% MoM in August against the expected 0%. On an annualized basis, industrial production data came in at -6.7% in August, below expectations of 0.8%.
The UK data is poor, but the sterling is under pressure from speculators. For this reason, the negative from the statistical data was ignored by the market, but taken into account in the medium term.
In the European Union, the volume of industrial production in August increased by 2.5% YoY, and by 1.5% MoM. This is certainly a positive factor for the economy, but the data was not won back by the market.
United States producer prices slowed down from 8.7% to 8.5%, which indicates the prospect of further reduction in inflation. Forecasts assumed a slowdown to 8.4%.
As a result, the US dollar was not under pressure from sellers.
Main financial topics discussed in the media:
UK Chancellor of the Exchequer Kwasi Kwarteng said the Bank of England would be blamed if UK markets fell next week.
Such a sharp statement towards the regulator led to a speculative strengthening of the pound sterling.
Analysis of trading charts from October 12
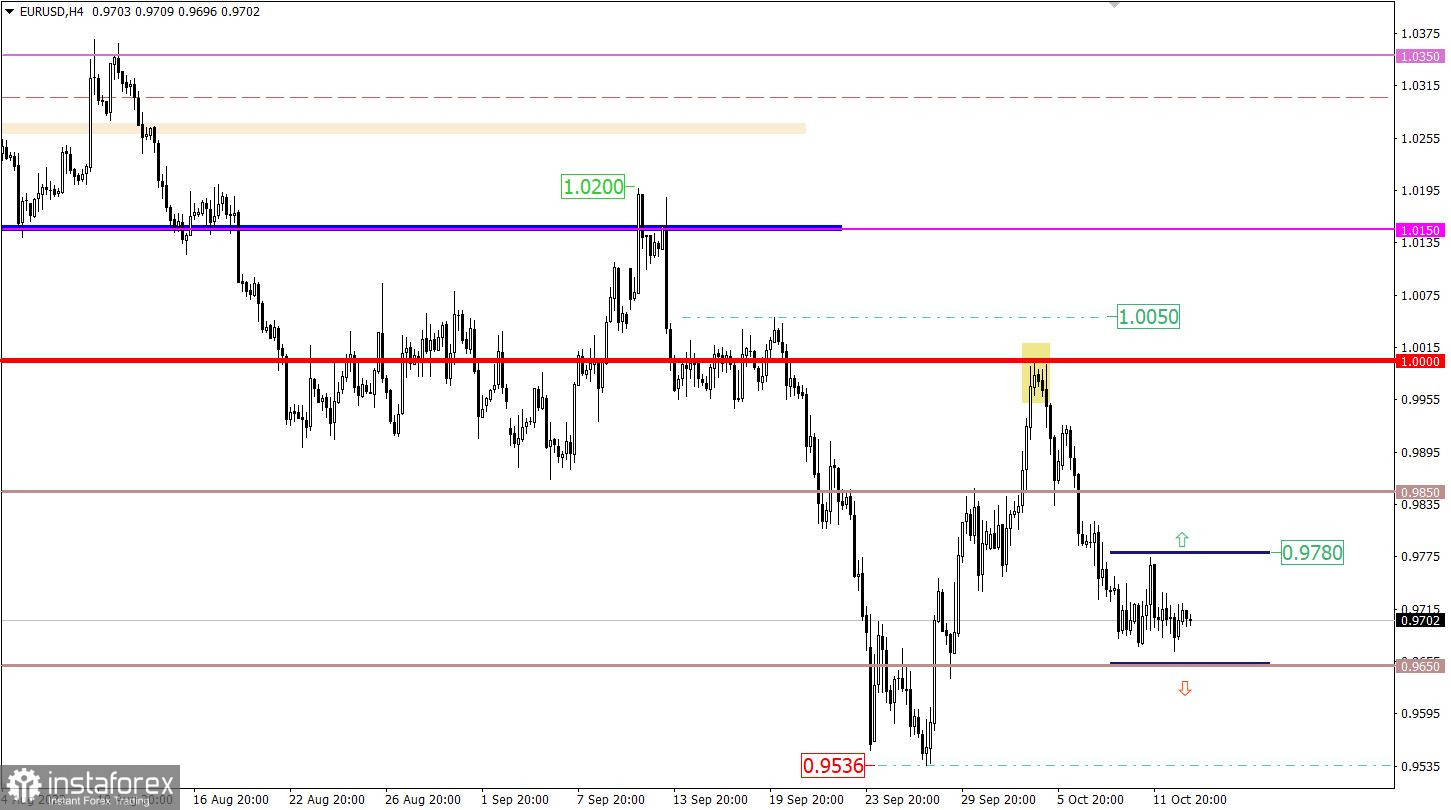
The EURUSD currency pair has formed a stagnation along the value of 0.9700, where the quote is moving for the second day in a row. This stagnation may well become a process of accumulation of trading forces, which will eventually lead to an increase in volatility.
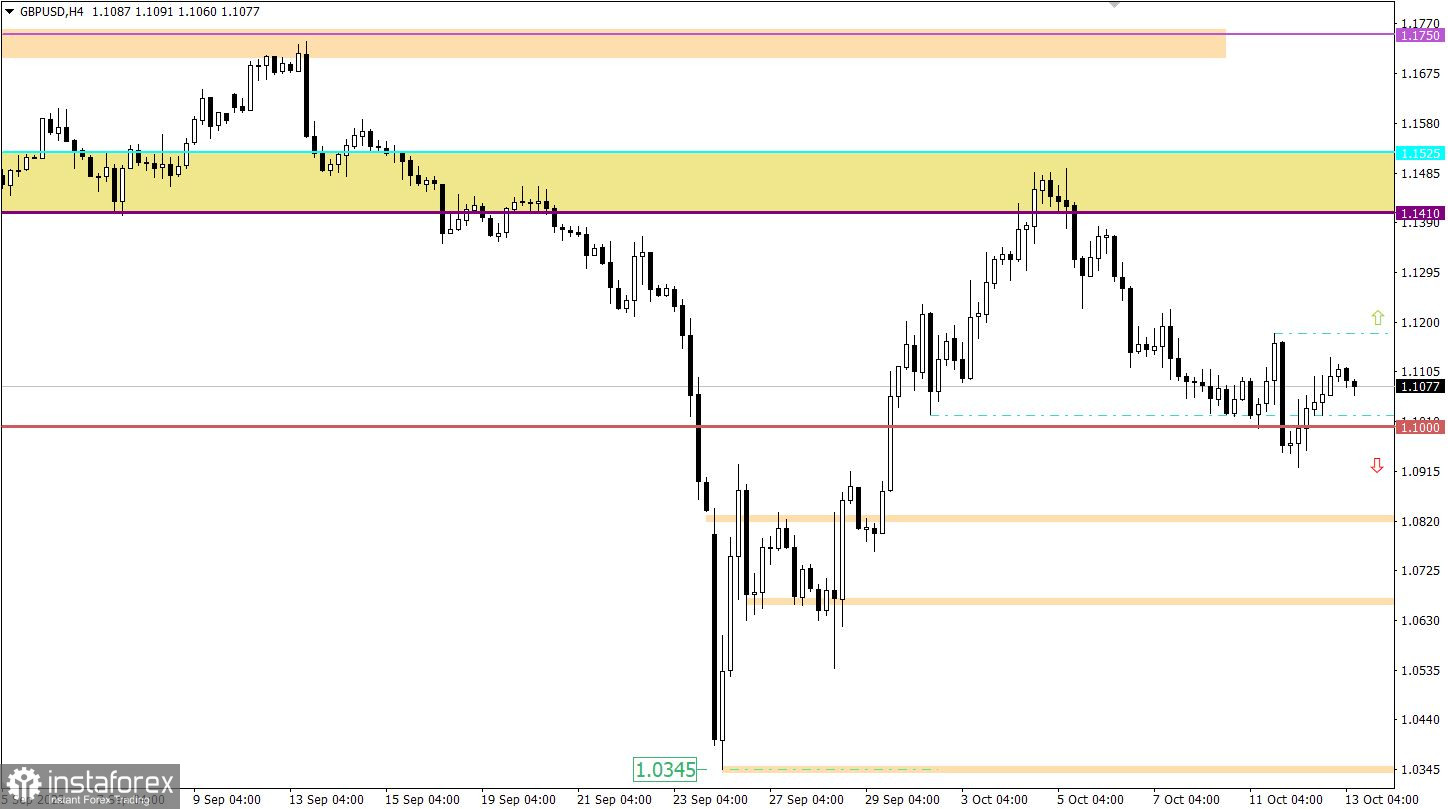
The GBPUSD currency pair, after a short stay of the price below the level of 1.1000, changed direction again. As a result, the quote rolled back to the value area of 1.1100, where a new price stagnation was formed.

Economic calendar for October 13
The main event of the week is considered to be the publication of data on inflation in the United States. Based on forecasts, the consumer price index is expected to decline from 8.3% to 8.1%, and this is the third consecutive decline in inflation. Such an impressive argument could be leverage for the Fed to hint that they will soon limit monetary tightening. In simple terms, there may not be any more large interest rate hikes, except for November.
In this case, the US dollar may well begin to weaken.
What happens if inflation stays the same?
In this case, strong speculative price jumps will arise, which will lead to a collapse in US stock indices, as well as high demand for dollar positions.
Data on weekly jobless claims in the United States is expected today, where figures are expected to grow. This is a negative factor for the US labor market. It is worth considering that these data will be in the background.
Statistics details:
The volume of continuing claims for benefits may rise from 1.361 million to 1.365 million.
The volume of initial claims for benefits may rise from 219,000 to 225,000.
Time targeting:
US inflation – 12:30 UTC
US Jobless Claims – 12:30 UTC
Trading plan for EUR/USD on October 13
It can be assumed that the current stagnation will soon complete its formation. It will lead to the initial momentum, based on which traders will receive a technical signal about a possible price move.
The descending scenario will be accepted into work if the price stays below 0.9650. In this case, there is a high probability that the price will return to the area of the local low of the downward trend at 0.9536.
The upside scenario will be considered by traders if the price stays above 0.9780. In this case, movement in the direction of 0.9850-1.0000 is possible.
Trading plan for GBP/USD on October 13
The recent pullback has led to a reassessment of the trading forces in the market, allowing for the possibility of the price returning to the 1.1410/1.1525 resistance level area. For this technical signal to be confirmed, the quote needs not only to stay above the level of 1.1000, but buyers of the pound sterling need to overcome the high of the current week at 1.1178.
As for the downside scenario, for it to be considered, the quote must again return below the level of 1.1000 for at least a four-hour period.
What is shown in the trading charts?
A candlestick chart view is graphical rectangles of white and black light, with sticks on top and bottom. When analyzing each candle in detail, you will see its characteristics of a relative period: the opening price, closing price, and maximum and minimum prices.
Horizontal levels are price coordinates, relative to which a stop or a price reversal may occur. These levels are called support and resistance in the market.
Circles and rectangles are highlighted examples where the price of the story unfolded. This color selection indicates horizontal lines that may put pressure on the quote in the future.
The up/down arrows are the reference points of the possible price direction in the future.


